
SLIDE 1
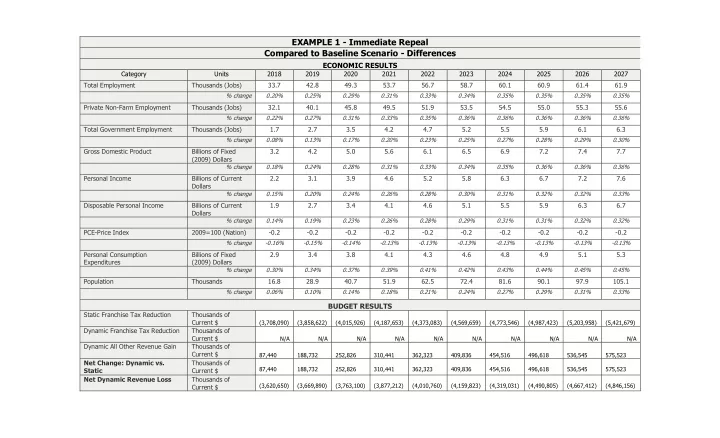
EXAMPLE 1 - Immediate Repeal Compared to Baseline Scenario - Differences
ECONOMIC RESULTS
Category Units 2018 2019 2020 2021 2022 2023 2024 2025 2026 2027 Total Employment Thousands (Jobs) 33.7 42.8 49.3 53.7 56.7 58.7 60.1 60.9 61.4 61.9
% change 0.20% 0.25% 0.29% 0.31% 0.33% 0.34% 0.35% 0.35% 0.35% 0.35%
Private Non-Farm Employment Thousands (Jobs) 32.1 40.1 45.8 49.5 51.9 53.5 54.5 55.0 55.3 55.6
% change 0.22% 0.27% 0.31% 0.33% 0.35% 0.36% 0.36% 0.36% 0.36% 0.36%
Total Government Employment Thousands (Jobs) 1.7 2.7 3.5 4.2 4.7 5.2 5.5 5.9 6.1 6.3
% change 0.08% 0.13% 0.17% 0.20% 0.23% 0.25% 0.27% 0.28% 0.29% 0.30%
Gross Domestic Product Billions of Fixed (2009) Dollars 3.2 4.2 5.0 5.6 6.1 6.5 6.9 7.2 7.4 7.7
% change 0.18% 0.24% 0.28% 0.31% 0.33% 0.34% 0.35% 0.36% 0.36% 0.36%
Personal Income Billions of Current Dollars 2.2 3.1 3.9 4.6 5.2 5.8 6.3 6.7 7.2 7.6
% change 0.15% 0.20% 0.24% 0.26% 0.28% 0.30% 0.31% 0.32% 0.32% 0.33%
Disposable Personal Income Billions of Current Dollars 1.9 2.7 3.4 4.1 4.6 5.1 5.5 5.9 6.3 6.7
% change 0.14% 0.19% 0.23% 0.26% 0.28% 0.29% 0.31% 0.31% 0.32% 0.32%
PCE-Price Index 2009=100 (Nation)
- 0.2
- 0.2
- 0.2
- 0.2
- 0.2
- 0.2
- 0.2
- 0.2
- 0.2
- 0.2
% change
- 0.16%
- 0.15%
- 0.14%
- 0.13%
- 0.13%
- 0.13%
- 0.13%
- 0.13%
- 0.13%
- 0.13%