electricity generation u s vs ky ky elec generation by
play

Electricity Generation U.S. vs. Ky Ky Elec. Generation by Type U.S. - PowerPoint PPT Presentation

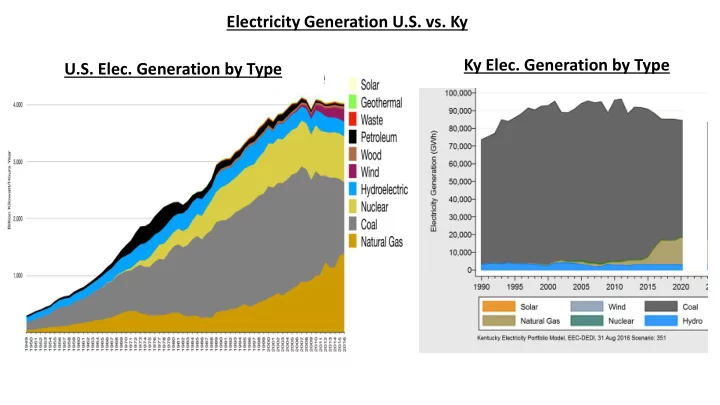
Electricity Generation U.S. vs. Ky Ky Elec. Generation by Type U.S. Elec. Generation by Type 100% Potential 98% 96% 94% BTU per Unit of Coal Loading Mining Transportation Storage Transformation


  1. Electricity Generation U.S. vs. Ky Ky Elec. Generation by Type U.S. Elec. Generation by Type

  2. 100% Potential 98% 96% 94% BTU per Unit of Coal Loading Mining Transportation Storage Transformation Combustion/ 31% Generation/ 36% Scrubbing 38% 24% Appliance 26% Usage Reduction Demand 20% 28%

  3. Examples of New Renewable Generation in Central Kentucky LG&E/KU E.W. Brown Mother Ann Lee Hydroelectric Generating Station: 10 MW Station: 2,040 kW East Kentucky Power: 8.5 MWs BMU Solar Lease: ~ 60 kW Geenex (In Development): 100 – 200 MWs

  4. End Use Saving Opportunities The 3 Keys to Energy Savings 1. Conservation 2. Energy Efficiency 3. Renewable Energy Return on Investment (ROI) *Savings go to the bottom line

Download Presentation
Download Policy: The content available on the website is offered to you 'AS IS' for your personal information and use only. It cannot be commercialized, licensed, or distributed on other websites without prior consent from the author. To download a presentation, simply click this link. If you encounter any difficulties during the download process, it's possible that the publisher has removed the file from their server.

Recommend


More recommend