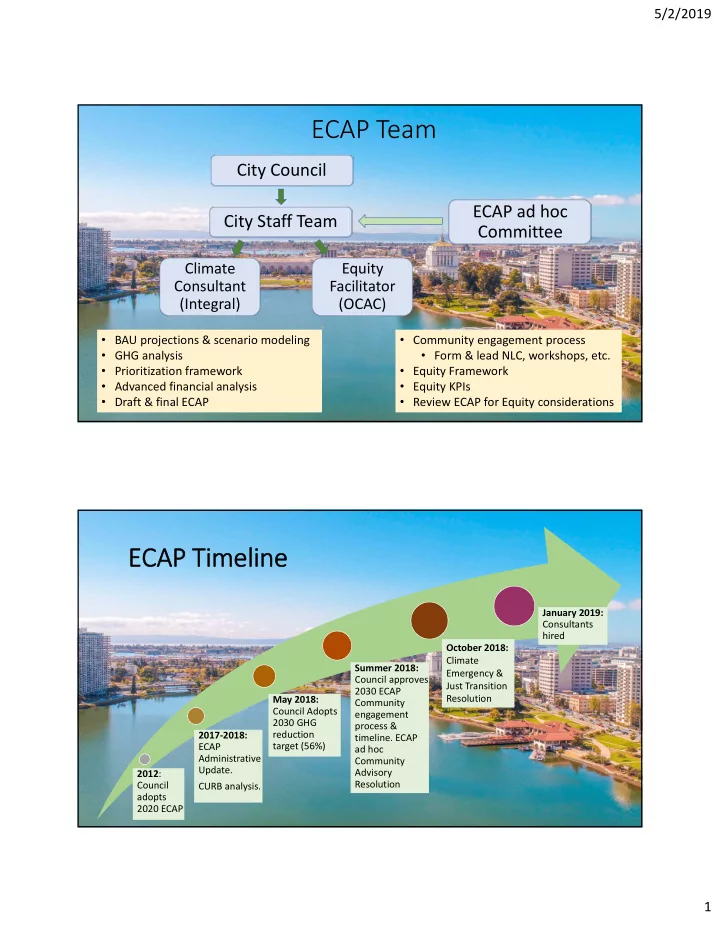
ECAP Team City Council ECAP ad hoc City Staff Team Committee - - PDF document

ecap team
SMART_READER_LITE
LIVE PREVIEW

ECAP Team City Council ECAP ad hoc City Staff Team Committee - - PDF document

5/2/2019 ECAP Team City Council ECAP ad hoc City Staff Team Committee Climate Equity Consultant Facilitator (Integral) (OCAC) BAU projections & scenario modeling Community engagement process GHG analysis Form &


slide-1
SLIDE 1

5/2/2019 1

ECAP Team

City Council City Staff Team

Climate Consultant (Integral)

ECAP ad hoc Committee

Equity Facilitator (OCAC)

  • BAU projections & scenario modeling
  • GHG analysis
  • Prioritization framework
  • Advanced financial analysis
  • Draft & final ECAP
  • Community engagement process
  • Form & lead NLC, workshops, etc.
  • Equity Framework
  • Equity KPIs
  • Review ECAP for Equity considerations

2012: Council adopts 2020 ECAP 2017‐2018: ECAP Administrative Update. CURB analysis. May 2018: Council Adopts 2030 GHG reduction target (56%) Summer 2018: Council approves 2030 ECAP Community engagement process &

  • timeline. ECAP

ad hoc Community Advisory Resolution January 2019: Consultants hired

ECAP Timeline

October 2018: Climate Emergency & Just Transition Resolution

slide-2
SLIDE 2

5/2/2019 2

Understanding the True Cost of Actions

Map sources of financing to all ECAP Actions (2017)

  • $228M in total cost
  • $161M spent
  • $194M in transportation

and land use

  • Dozens of funding

sources (General Fund, fees, grants, philanthropy, partnerships)

Understanding How Costs are Met

  • Detailed review of

climate action funding sources

  • Graphic support for

decision makers

  • Comprehensive

guide for American cities

slide-3
SLIDE 3

5/2/2019 3

Prioritizing Actions: Deep Decarbonization

“CURB” report provides Top Five actions to reach targets:

  • Decarbonize the Grid
  • Eliminate Fossil Fuel from

Building Heating

  • Improve Building Insulation

& Windows

  • Move Away from Private

Auto Trips

  • Electrify Remaining

Vehicles

2030 ECAP Values

  • Realistic: Actionable, measurable, & verifiable.
  • Ambitious: Responsive to the Climate Emergency.
  • Equitable: Prioritize actions that benefit frontline

communities and minimize burdens.

  • Balanced: Mitigation + adaptation; immediate +

“moonshot” actions; core + consumption emissions.

  • Adaptive: Flexible to accommodate technological,

political, and cultural shifts over 10 years.

slide-4
SLIDE 4

5/2/2019 4

Focusing Where it Counts

Source: Adapted from Integral Group

  • Equity in Governance:

Democracy From the Ground Up

  • Equity Today Builds Equity for

Tomorrow

  • A Connected & Resilient City
  • Civic Engagement for All
  • Health / Public Health
  • Adaptation / Resilience
  • Economic Security
  • Land Use

Priority Community Needs Equity Principles

slide-5
SLIDE 5

5/2/2019 5

Why Natural Gas?

  • Burned at power plants

and in homes, and leaking system‐wide

  • Short‐Lived Climate

Pollutant 86 times stronger than CO2 over 20 years

  • Elimination is critical for

2050 targets

  • Also increases seismic risk

Methane

slide-6
SLIDE 6

5/2/2019 6

Social, Racial, & Economic Equity

Oakland 2030 ECAP

How do we slow down Climate Change? How do we adapt to Climate Change?

Local Emissions

Life Cycle Emissions

Urban Forestry

Heat Flooding Sea Level Rise

Buildings & Energy Transportation Waste & Landfill Manufacturing & Production

Upstream energy Planting Trees Restoring Soil

Drought Fires

Urban Gardens

Resilient Buildings & Housing

Consumption

‐ 500,000.00 1,000,000.00 1,500,000.00 2,000,000.00 2,500,000.00 3,000,000.00 Buildings & Energy Use Public Transit & Vehicles Solid Waste Seaport Airport Overall

MT CO2e

2005‐2017 Local Emissions by Category

2005 2010 2013 2015 2017 34.0% 7.5% 20.9% 3.6% 16.1% 18.4%

slide-7
SLIDE 7

5/2/2019 7

Buildings & Energy Use 31% Public Transit & Vehicles 58% Solid Waste 3% Seaport 3% Airport 5%

2017 Local Emissions by Category

‐ 500,000.00 1,000,000.00 1,500,000.00 2,000,000.00 2,500,000.00 3,000,000.00 3,500,000.00 Buildings & Energy Use Public Transit & Vehicles Solid Waste Seaport & Ocean Vessels Airport Overall w/ Ocean Vessels MT CO2e

2005‐2017 Local Emissions by Category

2005 2010 2013 2015 2017

34.0% 7.5% 20.9% 7.2% 16.1% 17.9%

slide-8
SLIDE 8

5/2/2019 8

Buildings & Energy Use 29% Public Transit & Vehicles 54% Solid Waste 3% Seaport & Ocean Vessels 9% Airport 5%

2017 Local Emissions by Category