
SLIDE 1
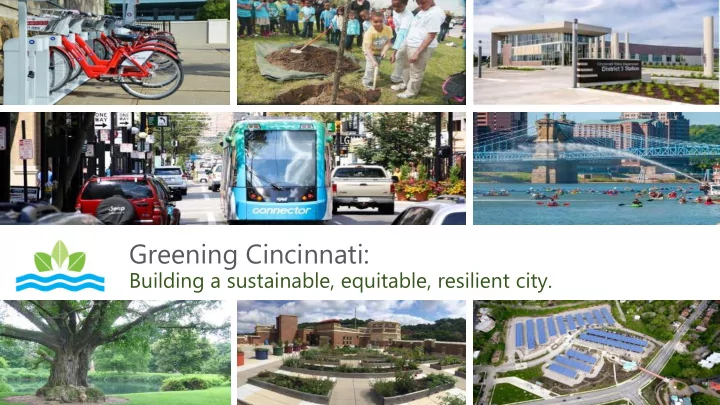
Greening Cincinnati:
Building a sustainable, equitable, resilient city.
Greening Cincinnati: Building a sustainable, equitable, resilient - - PowerPoint PPT Presentation
Greening Cincinnati: Building a sustainable, equitable, resilient city. CLIMATE CHANGE IN CINCINNATI HEAT PESTS HEALTH STORMS LANDSLIDES SEWER BACKUPS Cities claim 2% of the Earths surface, 54% of the human population, and over 70% of
Building a sustainable, equitable, resilient city.
HEAT PESTS HEALTH STORMS LANDSLIDES SEWER BACKUPS
Steering Committee Task Teams Green Umbrella Idea Bank Extreme Weather Task Force
University Analysis
Public Input
[CATEGORY NAME]
[VALUE]
[CATEGORY NAME]
[VALUE]
[CATEGORY NAME]
[VALUE]
[CATEGORY NAME]
[VALUE]
[CATEGORY NAME]
2.77% Water & Waste Water Treatment 2.35% [CATEGORY NAME] - [VALUE] [CATEGORY NAME] - [VALUE] [CATEGORY NAME] - [VALUE] [CATEGORY NAME] - [VALUE]
Government 3.62%
metric tons of carbon emitted in Cincinnati in 2015
consumes
BUILT ENVIRONMENT
EDUCATION & OUTREACH
ENERGY FOOD NATURAL SYSTEMS RESILIENCE TRANSPORTATION WASTE
Reduction in Community Carbon Emissions since 2006
Reduction in Govt. Carbon Emissions since 2006
Environmental Compliance Environmental Management Environmental Quality Environmental Sustainability Environmental Resilience Health Environmental Justice Economy Climate Action Storm Damages