
Determination of Dry Coating
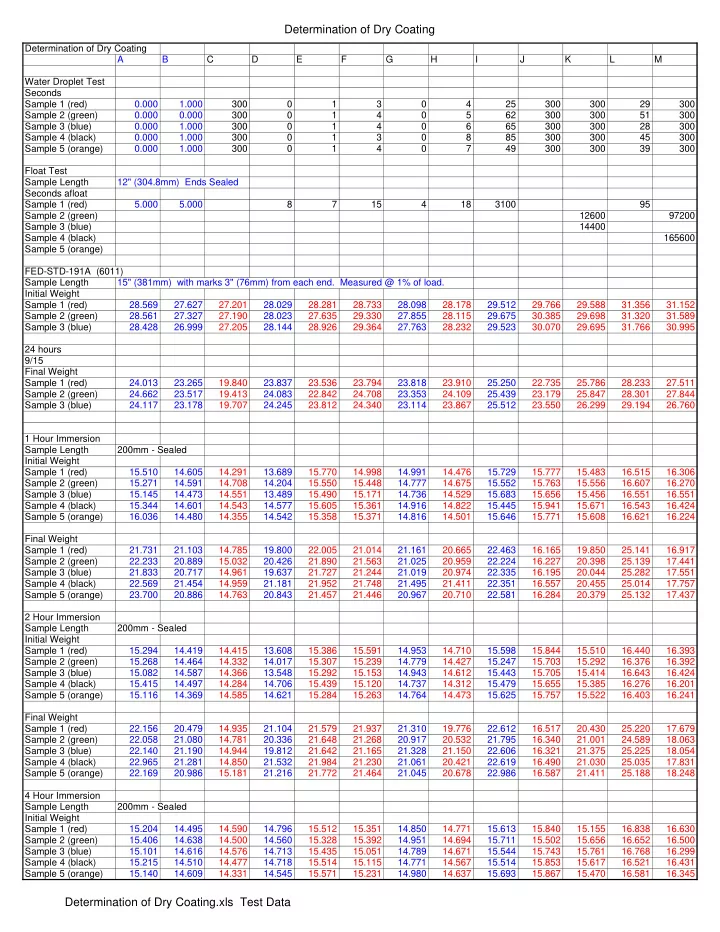
Determination of Dry Coating A B C D E F G H I J K L M Water Droplet Test Seconds Sample 1 (red) 0.000 1.000 300 1 3 4 25 300 300 29 300 Sample 2 (green) 0.000 0.000 300 1 4 5 62 300 300 51 300 Sample 3 (blue) 0.000 1.000 300 1 4 6 65 300 300 28 300 Sample 4 (black) 0.000 1.000 300 1 3 8 85 300 300 45 300 Sample 5 (orange) 0.000 1.000 300 1 4 7 49 300 300 39 300 Float Test Sample Length 12" (304.8mm) Ends Sealed Seconds afloat Sample 1 (red) 5.000 5.000 8 7 15 4 18 3100 95 Sample 2 (green) 12600 97200 Sample 3 (blue) 14400 Sample 4 (black) 165600 Sample 5 (orange) FED-STD-191A (6011) Sample Length 15" (381mm) with marks 3" (76mm) from each end. Measured @ 1% of load. Initial Weight Sample 1 (red) 28.569 27.627 27.201 28.029 28.281 28.733 28.098 28.178 29.512 29.766 29.588 31.356 31.152 Sample 2 (green) 28.561 27.327 27.190 28.023 27.635 29.330 27.855 28.115 29.675 30.385 29.698 31.320 31.589 Sample 3 (blue) 28.428 26.999 27.205 28.144 28.926 29.364 27.763 28.232 29.523 30.070 29.695 31.766 30.995 24 hours 9/15 Final Weight Sample 1 (red) 24.013 23.265 19.840 23.837 23.536 23.794 23.818 23.910 25.250 22.735 25.786 28.233 27.511 Sample 2 (green) 24.662 23.517 19.413 24.083 22.842 24.708 23.353 24.109 25.439 23.179 25.847 28.301 27.844 Sample 3 (blue) 24.117 23.178 19.707 24.245 23.812 24.340 23.114 23.867 25.512 23.550 26.299 29.194 26.760 1 Hour Immersion Sample Length 200mm - Sealed Initial Weight Sample 1 (red) 15.510 14.605 14.291 13.689 15.770 14.998 14.991 14.476 15.729 15.777 15.483 16.515 16.306 Sample 2 (green) 15.271 14.591 14.708 14.204 15.550 15.448 14.777 14.675 15.552 15.763 15.556 16.607 16.270 Sample 3 (blue) 15.145 14.473 14.551 13.489 15.490 15.171 14.736 14.529 15.683 15.656 15.456 16.551 16.551 Sample 4 (black) 15.344 14.601 14.543 14.577 15.605 15.361 14.916 14.822 15.445 15.941 15.671 16.543 16.424 Sample 5 (orange) 16.036 14.480 14.355 14.542 15.358 15.371 14.816 14.501 15.646 15.771 15.608 16.621 16.224 Final Weight Sample 1 (red) 21.731 21.103 14.785 19.800 22.005 21.014 21.161 20.665 22.463 16.165 19.850 25.141 16.917 Sample 2 (green) 22.233 20.889 15.032 20.426 21.890 21.563 21.025 20.959 22.224 16.227 20.398 25.139 17.441 Sample 3 (blue) 21.833 20.717 14.961 19.637 21.727 21.244 21.019 20.974 22.335 16.195 20.044 25.282 17.551 Sample 4 (black) 22.569 21.454 14.959 21.181 21.952 21.748 21.495 21.411 22.351 16.557 20.455 25.014 17.757 Sample 5 (orange) 23.700 20.886 14.763 20.843 21.457 21.446 20.967 20.710 22.581 16.284 20.379 25.132 17.437 2 Hour Immersion Sample Length 200mm - Sealed Initial Weight Sample 1 (red) 15.294 14.419 14.415 13.608 15.386 15.591 14.953 14.710 15.598 15.844 15.510 16.440 16.393 Sample 2 (green) 15.268 14.464 14.332 14.017 15.307 15.239 14.779 14.427 15.247 15.703 15.292 16.376 16.392 Sample 3 (blue) 15.082 14.587 14.366 13.548 15.292 15.153 14.943 14.612 15.443 15.705 15.414 16.643 16.424 Sample 4 (black) 15.415 14.497 14.284 14.706 15.439 15.120 14.737 14.312 15.479 15.655 15.385 16.276 16.201 Sample 5 (orange) 15.116 14.369 14.585 14.621 15.284 15.263 14.764 14.473 15.625 15.757 15.522 16.403 16.241 Final Weight Sample 1 (red) 22.156 20.479 14.935 21.104 21.579 21.937 21.310 19.776 22.612 16.517 20.430 25.220 17.679 Sample 2 (green) 22.058 21.080 14.781 20.336 21.648 21.268 20.917 20.532 21.795 16.340 21.001 24.589 18.063 Sample 3 (blue) 22.140 21.190 14.944 19.812 21.642 21.165 21.328 21.150 22.606 16.321 21.375 25.225 18.054 Sample 4 (black) 22.965 21.281 14.850 21.532 21.984 21.230 21.061 20.421 22.619 16.490 21.030 25.035 17.831 Sample 5 (orange) 22.169 20.986 15.181 21.216 21.772 21.464 21.045 20.678 22.986 16.587 21.411 25.188 18.248 4 Hour Immersion Sample Length 200mm - Sealed Initial Weight Sample 1 (red) 15.204 14.495 14.590 14.796 15.512 15.351 14.850 14.771 15.613 15.840 15.155 16.838 16.630 Sample 2 (green) 15.406 14.638 14.500 14.560 15.328 15.392 14.951 14.694 15.711 15.502 15.656 16.652 16.500 Sample 3 (blue) 15.101 14.616 14.576 14.713 15.435 15.051 14.789 14.671 15.544 15.743 15.761 16.768 16.299 Sample 4 (black) 15.215 14.510 14.477 14.718 15.514 15.115 14.771 14.567 15.514 15.853 15.617 16.521 16.431 Sample 5 (orange) 15.140 14.609 14.331 14.545 15.571 15.231 14.980 14.637 15.693 15.867 15.470 16.581 16.345
Determination of Dry Coating.xls Test Data