
SLIDE 1
1
TRENDS IN GLOBAL DRY BEAN MARKETING
REBECCA BRATTER EXECUTIVE DIRECTOR
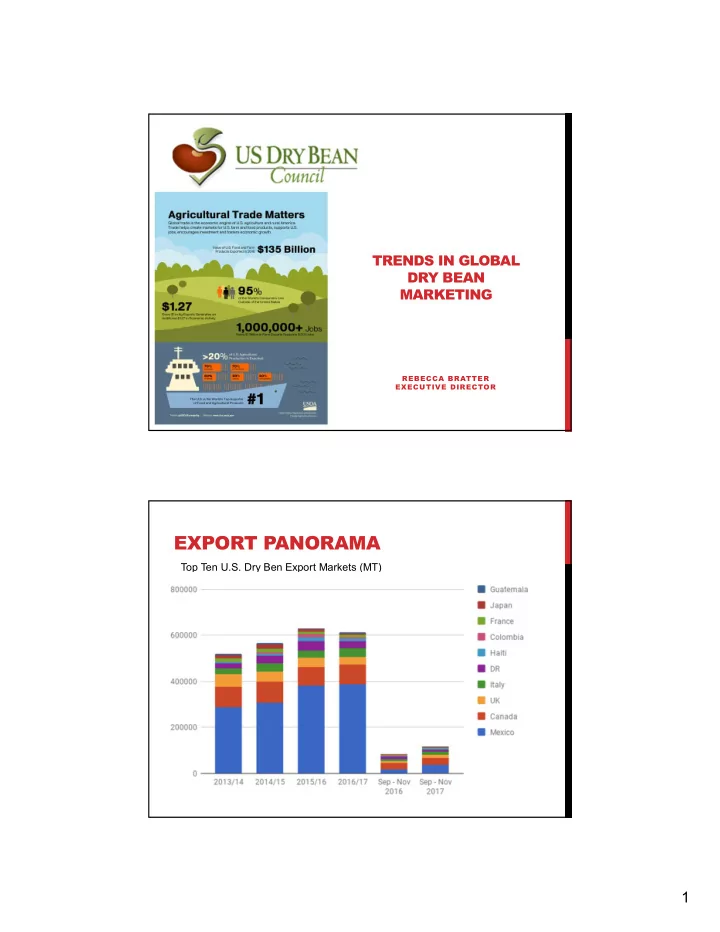
EXPORT PANORAMA
Top Ten U.S. Dry Ben Export Markets (MT)
EXPORT PANORAMA Top Ten U.S. Dry Ben Export Markets (MT) 1 EXPORTS - - PDF document
TRENDS IN GLOBAL DRY BEAN MARKETING REBECCA BRATTER EXECUTIVE DIRECTOR EXPORT PANORAMA Top Ten U.S. Dry Ben Export Markets (MT) 1 EXPORTS TO THE AMERICAS US Dry Bean Exports to South and Central America & the Caribbean Top
REBECCA BRATTER EXECUTIVE DIRECTOR
Top Ten U.S. Dry Ben Export Markets (MT)
US Dry Bean Exports to South and Central America & the Caribbean – Top Destinations (MT)
19% 12% 6% 13% 6% 13% 6% 25% Bakery Snacks Cookies Functional Ingredients Cereals Flours/Premixes New Product Development Consultant Food processing 41% 12% 12% 6% 6% 23% Gain knowledge on applications of dry-bean derivatives Gain knowledge on extrusion Lean about nutritional benefits Applications - Cookies Uses on refried beans Better understanding on Supply Chain Management
Potrais Cake Lebean, black bean filling Dehy Potato Pia, using U.S. dehy potato granules/powder, U.S. dry pulse fillings
Year Value Volume U.S. Market Share 2015 $5,902,000 6,900 8.4% 2016 $4,796,000 8,280 8.4% 2017 $6,824,000 8,530 8.5% 2018 $7,096,000 8,870 8.5% 2019 $7,380,000 9,225 8.6% 2020 $7,914,225 9,593 8.6% 2021 $8,250,000 10,000 8.7% 2022 $8,559,375 10,375 8.7% 2023 $9,180,000 10,800 8.7%
Source: USDA/FAS GATS data (Sept/Aug Marketing Year) Note: Includes dry beans and garbanzo beans
70,000 75,000 80,000 85,000 90,000 95,000 100,000 2015 2016 2017 82,000 90000 97000
2015 2016 2017
U.S. dry bean exports to DR by type, in MT
Company (U.S. TRQ) 2016 2017 2018 GRANOS NACIONALES 2,772 2,992 2,860 AGROCOMERCIAL IMPORT 2,662 2,816 2,838 CASA CHEPE 1,662 1,804 2,024 IMPORTADA DEL SUR 1,220 1,254 1,254 CARIBBEAN GRAIN 638 814 860
PROCESADORA DE GRANOSMAGUANA
660 462 476 TOTAL ANNUAL TRQ 14,160 14,720 15,280
15,280 MT from US enters duty free Jan. 1 – Dec. 31.
U.S. Dry Bean Exports to Brazil (MT)
Source: Conab
Source: FAO