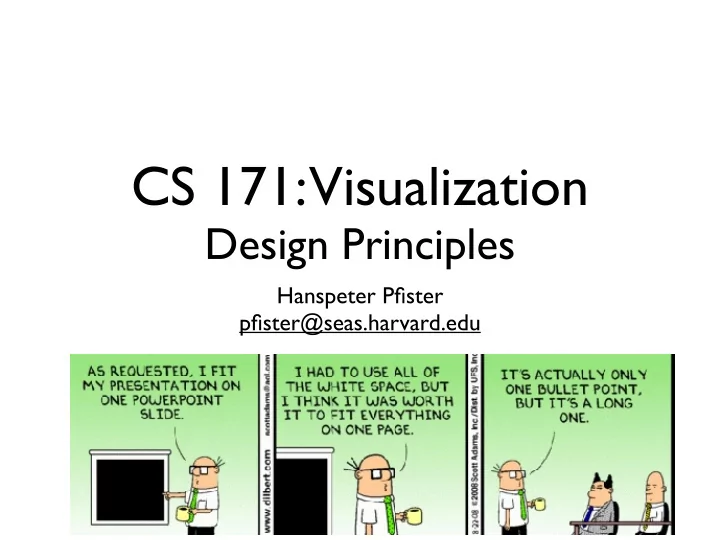

CS 171: Visualization Design Principles Hanspeter Pfister pfister@seas.harvard.edu
Last Time
Visualization To convey information through graphical representations of data
Due This Week • HW0, including course survey (due tonight) • Readings week 1: A. Cairo and T. Munzner
Design Critique
NYT, 2008 Print Edition
Last.fm Listening History
Harvard Business Review June 2010, HBR by Jeff Clark
Design
Design “Design must be functional and functionality must be translated into visual aesthetics, without any reliance on gimmicks that have to be explained.” F. A. Porsche
Graphical Design
Design Excellence “Clutter and confusion are not attributes of information, they are failures of design.” E. Tufte
Edward Tufte
Outline • Graphical Integrity • Visualization Design Principles • Graphic Design Principles
Graphical Integrity
Missing Scales ($11,410) ($4,200,000) Tufte, VDQI
Scale Distortions Nielson
Scale Distortions Flowing Data
Scale Distortions Flowing Data
Scale Distortions A. Kriebel, VizWiz
Scale Distortions
Scale Distortions
Scale Distortions
Scale Distortions
Global Warming? The Daily Mail, UK, Jan 2012
Global Warming? Mother Jones
Global Warming! Mother Jones
The Lie Factor Size of effect shown in graphic Size of effect in data Tufte, VDQI
The Lie Factor Tufte, VDQI
U.S. SmartPhone Marketshare 21.2% 39.0% RIM 3.1% Apple 7.4% Palm Motorola Nokia 9.8% Other 19.5%
U.S. SmartPhone Marketshare 21.2% RIM 39.0% Apple 3.1% Palm Motorola 7.4% Nokia Other 9.8% 19.5%
U.S. SmartPhone Marketshare 40% 39.0 30% 20% 21.2 19.5 10% 9.8 7.4 3.1 0% RIM Other Apple Palm Motorola Nokia
Tufte’s Integrity Principles • Clear, detailed, and thorough labeling and appropriate scales • Size of the graphic effect should be directly proportional to the numerical quantities (“lie factor”) • Show data variation, not design variation
Visualization Design Principles
Maximize Data-Ink Ratio Data ink Data-Ink Ratio = Total ink used in graphic 700 525 350 175 Males 0 Females 0-$24,999 $25,000+ 0-$24,999 $25,000+
Maximize Data-Ink Ratio Data ink Data-Ink Ratio = Total ink used in graphic 700 525 350 175 0 Males Females 0-$24,999 $25,000+ 0-$24,999 $25,000+
Avoid Chartjunk Extraneous visual elements that distract from the message ongoing, Tim Brey
Avoid Chartjunk ongoing, Tim Brey
Avoid Chartjunk ongoing, Tim Brey
Avoid Chartjunk ongoing, Tim Brey
Avoid Chartjunk ongoing, Tim Brey
Avoid Chartjunk ongoing, Tim Brey
Increase Data Density Number data items Data density = Area of data in graphic Ho et al., “Thermal Conductivity of the Elements: A Comprehensive Review” J. Phys. Chem. 1974
A. Cairo, The Functional Art
M. Novotny and H. Hauser, “Outlier-Preserving Focus+Context Visualization in Parallel Coordinates,” IEEE Transactions on Visualization and Computer Graphics, 2006.
Steve Chappel and Reebe Garofalo in Rock 'N' Roll is Here to Pay: The History and Politics of the Music Industry, 1977
Tufte’s Design Principles • Maximize data-ink ratio • Avoid chart junk • Increase data density • Layer information
Subjective Dimensions • Aesthetics : Attractive things are perceived as more useful than unattractive ones • Style : Communicates brand, process, who the designer is • Playfulness : Encourages experimentation and exploration • Vividness : Can make a visualization more memorable Pat Hanrahan, Nov 2007
Graphic Design Principles
Robin Williams
C ontrast R epetition A lignment P roximity Robin Williams
C ontrast R epetition A lignment P roximity Robin Williams
Principle of Contrast If two items are not exactly the same, then make them different. Really different. Don’t be a wimp.
A. Cairo, The Functional Art
M. Meyer
D3, M. Bostock
R. Kosara, S. Miksch, and H. Hauser, “Focus+Context Taken Literally,” IEEE Computer Graphics and Applications, 2002.
C ontrast R epetition A lignment P roximity Robin Williams
Principle of Repetition Repeat some aspects of the design throughout the entire piece
Small Multiples D3, M. Bostock
A. Gelmann
M. Meyer, B. Wong, M. Styczynski and H. Pfister. “Pathline: A Tool For Comparative Functional Genomics”, Computer Graphics Forum, 2010
C ontrast R epetition A lignment P roximity Robin Williams
Principle of Alignment Nothing should be placed on the page arbitrarily Every item should have a visual connection with something else
D3, M. Bostock
M. Meyer, B. Wong, M. Styczynski and H. Pfister. “Pathline: A Tool For Comparative Functional Genomics”, Computer Graphics Forum, 2010
C. Partl, A. Lex, M. Streit, D. Kalkofen, K. Kashofer, and D. Schmalstieg, “enRoute: Dynamic Path Extraction from Biological Pathway Maps for In-Depth Experimental Data Analysis,” IEEE Symposium on Biological Data Visualization, 2012
C ontrast R epetition A lignment P roximity Robin Williams
Principle of Proximity Group related items together . . . as physical closeness implies a relationship
Proximity Protovis, M. Bostock
M. Meyer, T. Munzner, A. DePace, H. Pfister, “MulteeSum: A Tool for Comparative Spatial and Temporal Gene Expression Data”, IEEE Transactions on Visualization and Computer Graphics, 2010
M. Dörk, S. Carpendale, and C. Williamson, “Visualizing explicit and implicit relations of complex information spaces,” Information Visualization, 2012
C ontrast R epetition A lignment P roximity Robin Williams
Further Reading
Stephen Few
Graph Design IQ Test Stephen Few, Perceptual Edge
Garr Reynolds
Next Week • HW1(due Thursday) • Bring laptops on Tuesday (Intro to Python) • Readings: Carpendale and Cleveland / McGill
Recommend
More recommend