
SLIDE 1
CS 171: Visualization Data Abstraction & Data Types
Alexander Lex alex@seas.harvard.edu
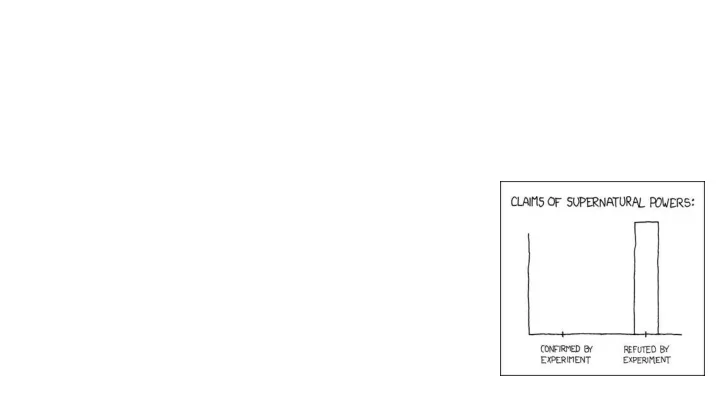
[xkcd]
CS 171: Visualization Data Abstraction & Data Types Alexander - - PowerPoint PPT Presentation
CS 171: Visualization Data Abstraction & Data Types Alexander Lex alex@seas.harvard.edu [xkcd] This Week Homework 0: due tomorrow! NEW: ANNOUNCE REPOSITORY & tell us if you dont have a micro account yet http://goo.gl/HFVE6h
Alexander Lex alex@seas.harvard.edu
[xkcd]
due tomorrow!
NEW: ANNOUNCE REPOSITORY & tell us if you don’t have a micro account yet http://goo.gl/HFVE6h
D3: Chapters 5-8 VAD: Chapter 2
except when used for exercises
It’s better to take notes by hand Notifications are designed to grab your attention
+~40 relative to 2014 +~80 relative to 2013
Primary Secondary
Visualization is the process that transforms (abstract) data into interactive graphical representations for the purpose of exploration, confirmation, or presentation.
How did the unemployment and labor force develop over the last years?
Which combination of genes causes cancer? Which drug can help patient X?
[New York Times]
Which gene is most frequently mutated in this set of patients? What is the current unemployment rate?
High frequency stock market trading: which stock to buy/sell? Manufacturing: is bottle broken?
I x y 10 8.0 8 6.9 13 7.5 9 8.8 11 8.3 14 9.9 6 7.2 4 4.2 12 10. 7 4.8 5 5.6 II x y 10 9.1 8 8.1 13 8.7 9 8.7 11 9.2 14 8.1 6 6.1 4 3.1 12 9.1 7 7.2 5 4.7 III x y 10 7.4 8 6.7 13 12. 9 7.1 11 7.8 14 8.8 6 6.0 4 5.3 12 8.1 7 6.4 5 5.7 IV x y 8 6.5 8 5.7 8 7.7 8 8.8 8 8.4 8 7.0 8 5.2 19 12. 8 5.5 8 7.9 8 6.8
Mean x: 9 y: 7.50 Variance x: 11 y: 4.122 Correlation x – y: 0.816 Linear regression: y = 3.00 + 0.500x
Mean x: 9 y: 7.50 Variance x: 11 y: 4.122 Correlation x – y: 0.816 Linear regression: y = 3.00 + 0.500x
Redesign by Perceptual Edge
what can be visualized?
fundamental units combinations make up Dataset Types
Tables
Attributes (columns) Items (rows) Cell containing value
Networks
Link Node (item)
Trees
Fields (Continuous)
Attributes (columns) Value in cell
Cell
Multidimensional Table
Value in cell
Grid of positions
Geometry (Spatial)
Position
Dataset Types
Data Types Items Attributes Links Positions Grids
known data types, semantics
Tables
Attributes (columns) Items (rows) Cell containing value
Networks
Link Node (item)
Trees
Fields (Continuous)
Attributes (columns) Value in cellCell
Multidimensional Table
Value in cellGrid of positions
Geometry (Spatial)
Position
Dataset Types
no predefined data model text-heavy, interspersed with facts (dates, times, locations) video, images Translate into structured data Natural Language Processing Text mining (sentiment, keywords, concepts, categories)
Network Structure derived from pattern “X begat Y” Source: King James Bible
[van Ham, InfoVis 2009]
[van Ham, InfoVis 2009]
Name? City? Fruit? Height? Age? Day of Month? Metadata
Item, Link, Attribute, Position, Grid Different from data types in programming!
e.g., Patient, Car, Stock, City
e.g., Patient: height, blood pressure; Car: horsepower, make
Item: Person Attributes
Cell
Links
Express relationship between two items Friendship on Facebook, Interaction between proteins
Positions
Spatial data -> location in 2D or 3D Pixels in photo, Voxels in MRI scan, latitude/longitude
Grids
Sampling strategy for continuous data How many Voxels in MRI scan, positions of weather stations in the US
Tables
Attributes (columns) Items (rows) Cell containing value
Networks
Link Node (item)
Trees
Fields (Continuous)
Attributes (columns) Value in cell
Cell
Multidimensional Table
Value in cell
Grid of positions
Geometry (Spatial)
Position
Dataset Types
each column is attribute unique (implicit) key no duplicates
indexing based on multiple keys
Item Values Keys Attributes
Keys: Patients Keys: Genes
More in Lecture 8: High-Dimensional Data
No multi-edges No loops
Node-Link Diagram Matrix Treemap (Implicit Tree Visualization) More in Lecture 10: Trees & Networks
Temperature, pressure, wind velocity
Signal processing & stats
Geometry & topology can be computed
Nonuniform sampling
allows curvilinear grids
full flexibility, store position and connection
[Wikipedia]
[Bruckner 2007]
More in Lecture 12: Maps & Lecture 15: Visualizing spatial data: Volumes and Flows
Tables, Graphs
InfoVis: White Background SciVis: Black Background
Unique items, unordered
Ordered, duplicates allowed
Groups of similar items
Which classes of values & measurements are there? Categorical (nominal)
Compare equality Fruit, Gender, Movie Genres, File Types
Ordered
Ordinal Great/Less than defined Shirt size, Rankings Quantitative Arithmetic possible Length, Weight, Count
Categorical Ordered
Ordinal Quantitative
Dates: Jan 19; Location: (Lat, Long) Cannot compare directly. Temp in C & F Only differences (i.e., intervals) can be compared
zero: there is nothing of the measured entity observed Measurements: Length, Mass Can measure ratios & proportions
On the theory of scales and measurements [S. Stevens, 46]
Operations: =, ≠
Operations: =, ≠, >, <
Operations: =, ≠, >, <, +, − (distance)
Operations: =, ≠, >, <, +, −,×, ÷ (proportions)
On the theory of scales and measurements [S. Stevens, 46]
homogeneous from min to max # people in countries
two or multiple sequences that meet Elevation dataset: above sea level & below sea level
time (hours, week, month, year)
might be patterns on multiple levels
Respiratory disease cases. Left: 25 day pattern Right: 28 day pattern [Tominski 2008]
Weekly use of CS 171 website. Daily use of CS 171 website.
Item/Element/ (Independent) Variable
Attribute/ Dimension/ (Dependent) Variable/ Feature
Semantics
Set with operations, e.g., floats with +, -, /, *
Includes semantics, supports reasoning
Data Conceptual 1D floats temperature 3D vector of floats space
32.5, 54.0, -17.3, … (floats)
Temperature
Continuous to 4 significant digits (Q) Hot, warm, cold (O) Burned vs. Not burned (N)