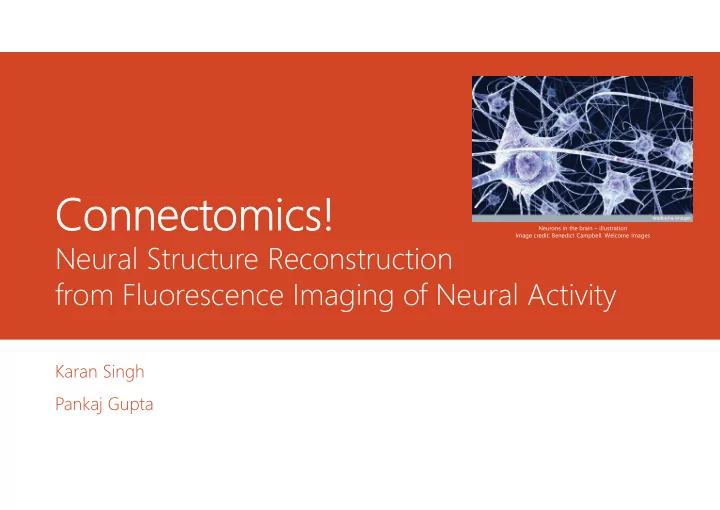

Connectomics! Neurons in the brain – illustration Image credit: Benedict Campbell. Welcome Images Neural Structure Reconstruction from Fluorescence Imaging of Neural Activity Karan Singh Pankaj Gupta
Objectives • Communicate research ideas and results. • Study the broad perspective. • You know what this is about ! • Keep the talk enjoyable . Credits: PHD Comics
Some Biology? The dendrites receive signals from other neurons. • A synapse allows signal transmission from one neuron to the target cell. • Neuro-transmitters transmit signals across synaptic cleft. • Calcium influx causes the release of neural transmitters. • Structure of Neuron Image from Dr. C. George Boeree. Fluorescence dye labelled Calcium allows study of neural activity. •
The T ask Data ? Predict Directed Time Series connections Activity of 1000 between neurons neurons Brain of the zebrafish in action. Credits: Arens et al. Nature 485, 471–477 (May 2012).
Why? Gaining a better understanding of the brain. • How does the brain learn? • Increase understanding of intelligent systems in general. • Alterations in brain structure caused by diseases. • Treatment through a better understanding. • Epilepsy, Alzheimer's disease, Dementia. • PET scan of the brain of a person with AD showing a loss of function in the temporal lobe Credits: Wikipedia
Some Statistics Typical number of neurons ~ 100 billion • Average number of synaptic connections ~ 7000 • Neuroanatomic methods of axonal tracing do NOT scale. • Electron microscopy • Labour intensive • Expensive • No in vivo mode of operation • Time Series Data Credits: ChaLearn Connectomics Challenge
Causal Relations The firing of a presynaptic neuron ( source of directed links) is expected to affect the probability of firing of its postsynaptic neurons ( targets of the directed links). Excitatory the probability of firing will rise. • Inhibitory probability of firing would decrease. • We consider exclusive excitatory neuronal connectivity. Time variation of neural activity. Credits: Self
And we run into problems… 552: Correlation Credits: xkcd 925: Cell Phones Credits: xkcd
Fundamental Contributions C Credits: Amazon Judea Pearl Clive Granger 2011 ACM Turing Award 2003 Nobel Prize in Economics "for fundamental contributions to artificial intelligence “for methods of analyzing economic through the development of a calculus for probabilistic time series with common trends” and causal reasoning"
Time Series Data is Ubiquitous Understanding Climate Change Data Credits: [CIKM Tutorial]
Granger Causality
Granger Causality
Notes on “Statistically Significant” Any statistic blind to hypothesis-space complexity will indicate a better fit when number of parameters are more. • Need to penalize on basis of number of parameters used in the model. • Seeming popular in literature, Akaike information criterion • k is the number of parameters in the statistical model • L is the maximized value of the likelihood function for the estimated model. •
Example Credits: [CIKM Tutorial]
"Of course, many ridiculous papers appeared!“ – Clive Granger, 2003 Nobel Lecture Source: Lecture Slides from Econometrics II www.bauer.eh.edu
Granger Causality Extended Vector-Auto-Regression (VAR) based Granger causality test assumes linear dependence. • How to handle Latent Factors ? • For Local Impact Latent Factor For Global Impact Latent Factor Credits: [CIKM Tutorial]
Overview of proposed methods Cross-correlation • Granger Causality •
Overview of proposed methods Generalized Transfer Entropy • Information Gain •
Transfer Entropy
Transfer Entropy The average number of bits needed to encode independent draws of a r.v. I following a distribution p(i) is Excess number of bits coded if a different distribution q(i) is used for the coding instead of the actual underlying distribution p(i) Excess amount of code produced by assuming that the two systems are independent Excess amount of code produced in coding “destination” variable I by assuming that the next state of the destination variable is independent of the “source” variable J
Dataset Data provided • 20 ms time series data for hundred/thousand neuron. • Coordinates of each neuron. • Ground truth (except for test set). • The data has been provided under • Varying settings of sub-normal and super-active neural activity • Different values of clustering coefficient •
Evaluation Metric We return a numerical score between 0 and 1 indicating our • “confidence” that there is a directed connection. Prediction label 1 label 0 label 1 tp fn Truth label 0 fp tn True positive ratio = tp/(tp+fn) = Recall(Label 1) • False positive ratio = fp/(fp+tn) = 1-Recall(Label 0) Aim: Maximize area under the ROC curve. • ROC curve Credits: Wikipedia
Challenges Possibly high signal-to-noise ratio. • Solution: Use signal deconvolution methods. • Robustness with respect to Collective Synchrony. • Solution: Conditioning on global mean activity. • Insufficient resolution of time series data. • Credits: 3D Deconvolution Microscopy Challenge
References [1] (Challenge) ChaLearn Connectomics Challenge http://connectomics.chalearn.org/ [2] (CIKM Tutorial) Causality Analysis in Large-scale Time Series Data, Yan Liu, CIKM 2013 Tutorial [3] (Stetter, 2012) Model-Free Reconstruction of Excitatory Neuronal Connectivity from Calcium Imaging Signals, Olav Stetter, Demian Battaglia, Jordi Soriano, Theo Geisel, PLOS Computational Biology, August 2012, Volume 8. [4] (Nolte-Muller, 2010) Localizing and Estimating Causal Relations of Interacting Brain Rhythms. Guido Nolte, and Klaus-Robert Müller, Front Hum Neurosci. 2010; 4: 209, 2010. [5] (Orlandi, 2013) Transfer Entropy reconstruction and labelling of neuronal connections from simulated calcium imaging, Orlandi, J.G., Stetter, O., Soriano, J., Geisel, T., and Battaglia, D. (2013). ArXiv 1309.4287.
QA & Thank You! Suggestions
Recommend
More recommend