
SLIDE 1
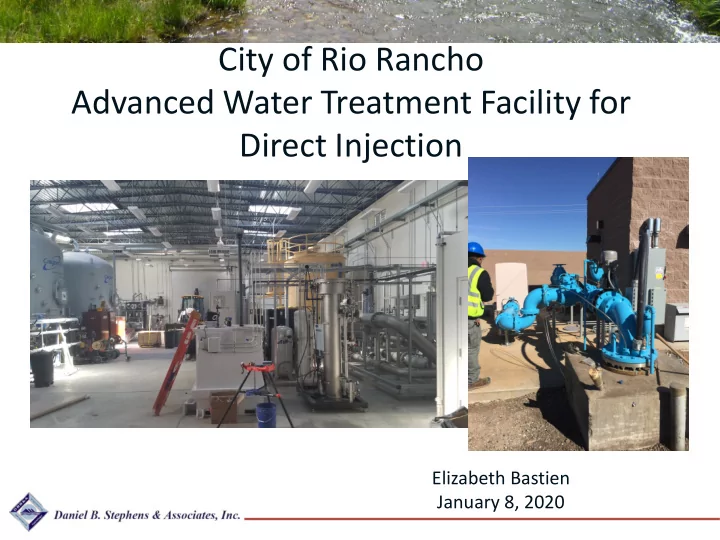
City of Rio Rancho Advanced Water Treatment Facility for Direct Injection
Elizabeth Bastien January 8, 2020
City of Rio Rancho Advanced Water Treatment Facility for Direct - - PowerPoint PPT Presentation
City of Rio Rancho Advanced Water Treatment Facility for Direct Injection Elizabeth Bastien January 8, 2020 Recharge Project Authorization In New Mexico, projects are authorized by the 1999 Groundwater Storage and Recovery Act (72-5A,
Elizabeth Bastien January 8, 2020
surface & groundwater fully appropriated.
from groundwater.
from ~0.5 million people in MRG basin to 2 million in the next 50 years.
to meet future demands.
Mariposa WRF
Source: Star Heights Park photo, City of Rio Rancho website
Secondary Treatment Filtration Advanced Treatment Direct Injection Non-Potable Reuse Surface Infiltration (originally)
AOP and GAC
50 100 150 200 250 300 350
1 , 7
i m e t h y l x a n t h i n e 4
y l p h e n
A m
i c i l l i n ( s e m i
u a n t i t a t i v e ) A t e n
B u t a l b i t a l C a f f e i n e C a r b a d
C a r b a m a z e p i n e C a r i s
r
D A C T D E E T D e h y d r
i f e d i p i n e D i l a n t i n F u r
i m i d e G e m f i b r
i l I
e x a l I
r
i d e * L i d
a i n e L
r e s s
M e c l
e n a m i c A c i d M e p r
a m a t e P r i m i d
e S u l f a d i a z i n e S u l f a d i m e t h
i n e S u l f a t h i a z
e T C E P T h e
r
i n e T h e
h y l l i n e T r i c l
a n
Trace Constituent Concentration (ng/L)
2 ppm ozone 6 ppm ozone Average MBR effluent 4 ppm ozone 8 ppm ozone
AOP: Bromate Formation
2 4 6 8 10 12 14 16 18 20 22 24 1 2 3 4 5 6 7 8 9 Ozone Dose (ppm) @ MR = 0.7 [BrO3-] / ppb 1 Injector 3 Injectors MCL
Ozone Only: Bromate Formation
2 4 6 8 10 12 14 16 18 20 22 24 1 2 3 4 5 6 7 8 9 Ozone Dose (ppm) @ MR = 0.7 [BrO3-] / ppb 1 Injector 3 Injectors MCL
AOP: Mole Ratio Study
2 4 6 8 10 12 14 16 18 20 0.2 0.4 0.6 0.8 1 1.2 1.4 1.6 1.8 2 MR H2O2:O3 [BrO3-] / ppb 4 ppm O3 5 ppm O3 6 ppm O3 MCL
Photo: Air Products, Inc.
backwash tank raw water tank treated water tank GAC/BAC AOP
Date AR-1 Recharge Backwash Net Recharge 7/19/2013(Demonstration) 27.6
Sub-Total 2017 28.6 7.4 21.3 Sub-Total 2018 29.7 3.9 25.8 Partial Sub-Total (Jan - Sept) 2019
Total Storage
commence.
Cabezon WRF and Advanced Water Treatment Facility)
to the injection well, including meter type, calibration, and location information.
– First quarter: January 1 through March 31 - report due by May 1 – Second quarter: April 1 through June 30 - report due by August 1 – Third quarter: July 1 through September 30 - report due by November 1 – Fourth quarter: October 1 through December 31 - report due by February 1
Enforceable Standards (MSES), a subset of which must be monitored on a quarterly basis, and the full suite must be monitored on an annual basis.
– Temp, pH, specific conductance, turbidity, chlorine residuals – Flow rates, total injection, backwash volume
– Most Stringent Enforceable Standards list
1/7/2020
4,700 4,750 4,800 4,850 4,900 4,950 5,000 5,050 5,100 Water Level (feet above mean sea level)
MW-1A MW-1B MW-1C MW-2 MW-3 AR-1
City of Rio Rancho Direct Injection Project Water Table Elevations, 2019