Characterizing Structural Transitions of Membrane Transport Proteins - - PowerPoint PPT Presentation

characterizing structural transitions of membrane
SMART_READER_LITE
LIVE PREVIEW

Characterizing Structural Transitions of Membrane Transport Proteins - - PowerPoint PPT Presentation

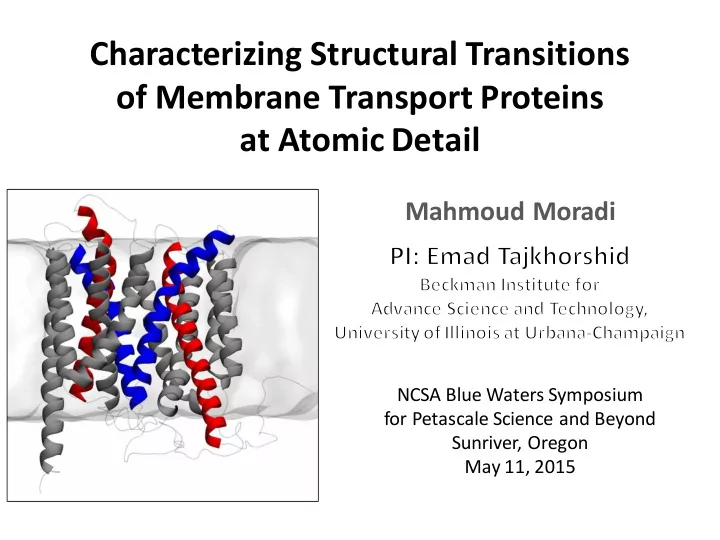
Characterizing Structural Transitions of Membrane Transport Proteins at Atomic Detail Mahmoud Moradi NCSA Blue Waters Symposium for Petascale Science and Beyond Sunriver, Oregon May 11, 2015 Outline Introduction GlpT transporter


slide-1
SLIDE 1

NCSA Blue Waters Symposium for Petascale Science and Beyond Sunriver, Oregon May 11, 2015

Characterizing Structural Transitions

  • f Membrane Transport Proteins

at Atomic Detail

Mahmoud Moradi

slide-2
SLIDE 2

Outline

  • Introduction

– GlpT transporter – Transport cycle thermodynamics

  • Methodology

– Empirical search for reaction coordinates using nonequilibrium simulations – Iterative path-finding algorithms and free energy calculations

  • Reconstructed thermodynamic cycle of GlpT

– Free energy profile along the cycle – Global and local conformational changes and their coupling

slide-3
SLIDE 3

Membrane Transporters

Glt GlpT MsbA

  • Transporters: Membrane proteins which

actively and selectively transport materials (proton, ions, small molecules) across cell membranes.

  • Active transport: Pumping substrates against their

concentration gradient (from low to high concentration).

  • Source of energy:

– metabolic energy, e.g. from ATP hydrolysis (primary). – electrochemical gradient of an ion (secondary).

slide-4
SLIDE 4

Alternating-Access Mechanism

  • Membrane transporters rely on

large-scale conformational changes to alternate between inward-facing (IF) and

  • utward-facing (OF) states

to pump the substrate against its concentration gradient, without being open (having the binding site accessible) to both sides of the membrane simultaneously.

IF apo IF bound in

  • ut

in

  • ut

OF apo

  • ut

in

  • ut

in OF bound

(OFa) (IFa) (OFb) (IFb)

slide-5
SLIDE 5

Glycerol-3-phophate (G3P) transporter (GlpT)

Huang, et al., Science 301, 616 (2003).

  • Major facilitator

superfamily (MFS)

  • Secondary active

transporter

  • Crystalized in the IF state.
  • GlpT transports G3P using

Pi gradient.

  • Pi:Piexchanger (in the

absence of organic phosphate)

  • Rate-limiting step: IF-OF

interconversion. periplasm cytoplasm

Pi G3P

slide-6
SLIDE 6

Pi

H7

Periplasm Cytoplasm

H1

IF

b

OF

b

Cytoplasm Periplasm

H5 H11

O F

a

I F

a

Transport cycle thermodynamics

slide-7
SLIDE 7

Lemieux, et al., Curr. Opin. Struct. Biol. 14, 405 (2004).

OFb IFb IFa OFa

Free Energy barrier Free Energy Transition State Reaction Coordinate

Law, et al., Biochemistry 46, 12190 (2007).

Transport cycle thermodynamics

a: apo b: bound

slide-8
SLIDE 8

Pi

H7

Periplasm Cytoplasm

H1

IF

b

OF

b

Cytoplasm Periplasm

H5 H11

O F

a

I F

a

Full thermodynamic cycle

slide-9
SLIDE 9

Pi

H7

Periplasm Cytoplasm

H1

IF

b

OF

b

Cytoplasm Periplasm

H5 H11

O F

a

I F

a

the only available crystal structure

slide-10
SLIDE 10

Sampling Strategies:

  • Long simulation

– application-specific computers

  • Multiple-copy simulations

– distributed computing

  • Enhanced sampling

– biased/adaptive simulations

  • Slow dynamics

– Timescale gap between feasible all-atom molecular dynamics (MD) simulations and actual functionally relevant biomolecular processes.

Key Challenge:

Loosely-coupled multiple-copy algorithms (petascale computing)

slide-11
SLIDE 11

Pi

H7

Periplasm Cytoplasm

H1

IF

b

OF

b

Cytoplasm Periplasm

H5 H11

O F

a

I F

a

Step 1: OFaIFa

slide-12
SLIDE 12

Work Reaction Coordinate

Empirical search for reaction coordinates and biasing protocols

Optimized Protocol Free Energy Calculations Path-Refining Algorithms

Theory/Method: Moradi et al., CPL 518 109 (2011) Moradi et al., JCP 140 034114,5 (2014) Moradi et al., JCTC 10 2866 (2014) Application: Moradi et al., PNAS 106 20746 (2009) Moradi et al., NAR 41 33 (2013) Moradi et al., PNAS 110 18916 (2013)

slide-13
SLIDE 13

about 100 simulations with different protocols

IFOF NonequilibriumWork

Empirical search for reaction coordinates and biasing protocols:

slide-14
SLIDE 14

Path-finding algorithms

  • String Method (finding approximate minimum free

energy pathways on high-dimensional spaces)

– A pathway is represented by a “string”, i.e., an ordered series of images connecting reactant and product regions. – The string is iteratively updated according to some ``rule’’ until converges to a stationary solution:

  • Maragliano, Fischer, Vanden-Eijnden, and Ciccotti
  • J. Chem. Phys. 2006, 125, 024106.
  • Ren, Vanden-Eijnden, Maragakis, and E
  • J. Chem. Phys. 2005, 123, 134109.
  • Vanden-Eijndenand Venturoli;J. Chem. Phys. 2009, 130, 194103.
slide-15
SLIDE 15

Path-finding algorithms

  • String Method with Swarms of Trajectories (SMwST):

– For each image tens of copies are launched: – Start with an initial string – (1) Restrain M copies of each image at the current – (2) Release the restraint – (3) Update the centers: – (4) Reparametrize

{Q} = {Q

1,Q2,...,Q 12}

Collective variables: Number of replicas: 50 X 20 = 1000 Simulation time: 1 ns/replica

  • rientation quaternions
  • f all helices

Pan, Sezer, and Roux

  • J. Phys. Chem. B 2008,

112, 3432−3440.

slide-16
SLIDE 16

Free energy calculations

  • Bias-exchange umbrella sampling (BEUS)

(Loosely coupled multiple-copy MD)

– Umbrella sampling – Replica-exchange MD

Reaction coordinate Free Energy Replica1 Replica2

UB(xi

t) = 1 2 k(xi t -xi)2

slide-17
SLIDE 17

Bias-Exchange Umbrella Sampling (Free Energy Calculation) String Method with Swarms of Trajectories (Path-Finding Algorithm) Post-Hoc String Method (Path-Finding Algorithm)

Iterative path-refining algorithms and free energy calculations

BEUS PHSM SMwST MCA MCA Analysis Technique

slide-18
SLIDE 18

Pi

H7

Periplasm Cytoplasm

H1

IF

b

OF

b

Cytoplasm Periplasm

H5 H11

O F

a

I F

a

Step 1: OFaIFa

slide-19
SLIDE 19

Pi

H7

Periplasm Cytoplasm

H1

IF

b

OF

b

Cytoplasm Periplasm

H 5 H11

O F

a

I F

a

Step 2: IFaIFb

slide-20
SLIDE 20

Pi

H7

Periplasm Cytoplasm

H1

IF

b

OF

b

Cytoplasm Periplasm

H 5 H11

O F

a

I F

a

Step 3: OFaOFb

slide-21
SLIDE 21

Pi

H7

Periplasm Cytoplasm

H1

IF

b

OF

b

Cytoplasm Periplasm

H 5 H11

O F

a

I F

a

Step 4: OFbIFb

slide-22
SLIDE 22

Transition Technique Collective Variables # of Replicas Runtime 1

IFa OFa

BEUS (Q1,Q7) 12 40 ns = 0.5 ms 2 SMwST {Q} 1000 1 ns = 1 ms 3 BEUS {Q} 50 20 ns = 1 ms 4

IFa IFb

BEUS ZPi 30 40 ns = 1.2 ms 5 BEUS ({Q}, ZPi) 30 40 ns = 1.2 ms 6 OFa

OFb

BEUS ZPi 30 40 ns = 1.2 ms 7 BEUS ({Q}, ZPi) 30 40 ns = 1.2 ms 8

IFb OFb

BEUS (Q1,Q7) 24 20 ns = 0.5 ms 9 BEUS ZPi 15 30 ns = 0.5 ms 10 2D BEUS ( RMSD, ZPi) 200 5 ns = 1 ms 11 SMwST ({Q}, ZPi) 1000 1 ns = 1 ms 12 BEUS ({Q}, ZPi) 50 20 ns = 1 ms 13 Full Cycle BEUS ({Q}, ZPi) 150 50 ns = 7.5 ms Total Simulation Time 18.7 ms

1 2 3 4 5 6 7 8 9 10 11 12

13

GlpT Crystal Structure Full Cycle BEUS SMwST PHSM

Nonequilibrium

Simulation protocols

Each replica consists of ~150,000 atoms

slide-23
SLIDE 23

Pi

H7

Periplasm Cytoplasm

H1

I F

b

O F

b

Cytoplasm Periplasm

H 5 H11

OF

a

IF

a

slide-24
SLIDE 24

IF

b

OF

b

O F

a

I F

a

slide-25
SLIDE 25

2 4 6 8 10 12 14 16 18 20 40 60 80 100 150 140 130 120 110 100

Free Energy (kcal/mol) Image Index Image Index

IFa IFb OFb OFa TSb TSa

฀ unbinding ฀ binding ฀ binding ฀ unbinding

slide-26
SLIDE 26
slide-27
SLIDE 27
slide-28
SLIDE 28
slide-29
SLIDE 29

Distinct conformational transition pathways

Quaternion-based principal components (QPCs) represent different modes of concerted motions of transmembrane helices.

with substrate without substrate

slide-30
SLIDE 30

IF

b

OF

b

OF

a

IF

a D 2 7 4 Pi K 8 Pi R 4 5 R 2 6 9 K 4 6 R 4 5 K 4 6 E 2 9 9 R 2 6 9

Characterizing protein local conformational changes within the lumen:

  • Salt bridges

stabilizing different conformations.

  • Residues involved

in binding. Conformational dynamics

  • f the binding site
slide-31
SLIDE 31
slide-32
SLIDE 32
  • Reconstructed thermodynamic cycle of GlpT

– Alternating access mechanism characterized (atomic level) – Substrate binding lowers the IF-OF transition barrier – Substrate binding changes the IF-OF transition pathway – Coupling between local and global conformational changes

  • Reconstructing transport cycles in membrane

transporters using enhanced sampling techniques and petascale computing

Moradi M., EnkaviG., and Tajkhorshid E., under review by Nature Communication (2015).

Summary

slide-33
SLIDE 33

Tajkhorshid Lab, Beckman Institute, UIUC Emad Tajkhorshid Giray Enkavi

Acknowledgement

Sundar Thangapandian, Jing Li, Po-Chao Wen, Josh Vermaas, Noah Trebesch, Javier Baylon, Mrinal Shekhar, Steven Wang

slide-34
SLIDE 34

Rocker-switch model