SLIDE 1
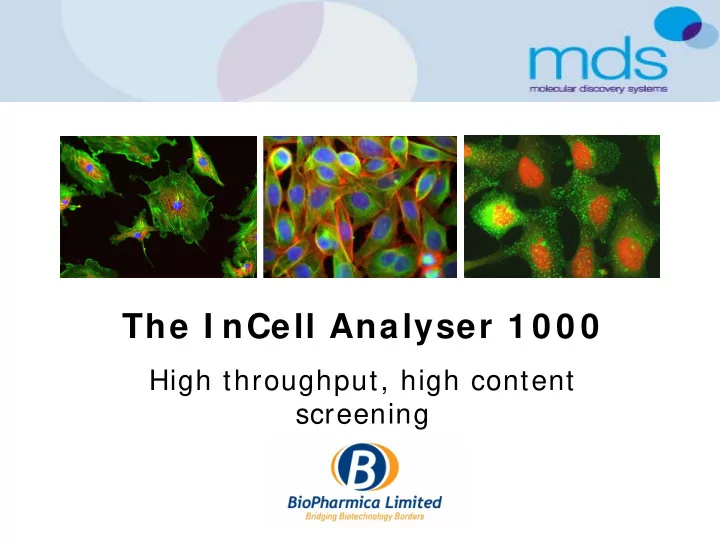
The I nCell Analyser 1 0 0 0
High throughput, high content screening
SLIDE 2
The InCell Analyser 1000
Automated cellular and subcellular imaging system. Built around epifluorescent based microscope and image acquisition software. Fixed and live cell imaging. Images maximum of 3 fluorescent wavelengths plus brightfield image. Acquires up to 2000 images per hour.
SLIDE 3 Hardware overview
Excitation 6 position wheel Emission 6 position wheel CCD camera CoolSNAP HQ Low noise high sensitivity High NA Objectives 4x, 10x, 20x, 40x High-speed laser autofocus <400msec per image SBS plate compatible
Optical Path
Illumination 100W xenon lamp Dichroic mirrors
SLIDE 4 Dichroic Mirrors
View from left-hand side of instrument showing position of dichroic mirrors
Excitation Emission Dichroic mirror
D360/40 HQ460/40 51008bs(FITC/Cy5) HQ405/20 HQ480/40 Q505LP (DAPI/FITC) D436/20 HQ535/50 51013bs (DAPI/Cy5) S475/20 HQ570/30 HQ500/20 HQ620/60 HQ535/50 HQ700/75 HQ570/20 HQ620/60
SLIDE 5 Objectives
Objective Magnification Objective Type Numerical Aperture (NA) Working Distance - mm Resolution Field of View (FOV) 4X 10X 20X 40X 1.60µm / pixel 15.7 0.2 Plan Apochromat Plan Apochromat 4.0 ELWD Plan Fluor 0.45 0.45 ELWD Plan Fluor 0.6 7.4 3.7 – 2.7 0.65µm / pixel 0.32µm / pixel 0.16µm / pixel 3.76mm2 0.60mm2 0.15mm2 0.04mm2
~ 1500 cells ~ 50-100 cells ~ 200-400 cells Molecular Probes Fluocells prepared slide #1. BPAE cells with MitoTracker Red CMXRos, BODIPY FL phallacidin, DAPI
4x Plan Apo 0.20NA 10x Plan Apo 0.45NA 20x Plan Fluor ELWD 0.45NA 40x Plan Fluor ELWD 0.6NA
10x 20x 40x
SLIDE 6
Plate Manager
Pre loaded with standard plate dimensions. New plate maps can be added as required. User specifies area the wells and the areas within wells to be imaged. Stores acquisition footprint.
SLIDE 7 Objective Air/plastic interface Plastic/liquid interface
Cells
Autofocus Laser based autofocus system Detects flat optical surfaces Locates plastic/liquid interface at each well Rapid, <400ms/well Autofocus offset Biology located using software algorithm Defined ex/em λ and exposure times Collects series of images acquired in z-axis Determines best focal position
Autofocus
SLIDE 8
Optional Features of Image Acquisition
Variable temperature control User defined optional plate heating (25 - 42°C). Useful for medium term, live cell imaging. Liquid handling Dispensing or aspirating reagent from 96- and 384- plates. Image combination Creates a single focused image from a set of images acquired at different focal planes. Particularly useful for thick specimens. Z dimension Allows collection of a set of images at different focal planes Up to 50 Z-dimension slices +/- 100 microns from HWAF position. Time series Allows consecutive image capture over a set period of time i.e. every 30 minutes over 24 hours.
SLIDE 9
Great data starts with great images!
SLIDE 10
I nCell Softw are packages
Developer Toolbox Build protocols from scratch. Much greater flexibility in analysis capability. Excellent for multiplex assays. Workstation Analysis protocols based on preset modules i.e. Object intensity, granularity, nuclear trafficking Some ‘training’ capabilities but core algorithms cannot be changed.
SLIDE 11 Basic Analysis Protocol
Define input images, wavelengths, assign objects Segment objects e.g. define nuclei, cells, organelles Select basic measurements e.g. intensity, area, cell/nuclear intensity Summarise measurements
SLIDE 12
Object Intensity
Quantifies changes in fluorescent labels in cells. Potential applications include cell viability (membrane permeability), ion mobilisation, membrane potential, protein expression and enzyme activity. Requires two fluorophores with distinct spectral profiles required to distinguish nuclei from intensity reporter. Measurements include; mean cell intensity, mean cytoplasm intensity, mean nuclei intensity etc.
SLIDE 13 Nuclear Trafficking
Quantifies movement of proteins between the nucleus and cytoplasm (in either direction). Two fluorophores required to distinguish nulcei and translocating molecules. Types of measurements include; mean N/C intensity, SD N/C intensity, mean nuclei intensity, mean cytoplasm intensity etc.
+TGF EGFP-SMAD-2 translocation from the cytoplasm to the nucleus
SLIDE 14
Granularity
Quantifies shape, size and intensity of granules within cells. 2 fluorophores with distinct spectral profiles required to distinguish nuclei from granules. Types of measurements include total granule area, granule area/cell, granule count, granule count/cell, mean granule area etc. A B C D
SLIDE 15
I m age Analysis
SLIDE 16
Developer Toolbox
Allows development of own automated analysis routines. Advanced segmentation tools. Macros (all graphical – no programming). Unlimited measurements.
SLIDE 17 Proliferation Assays
Counting nuclei of treated cells over a period of time. More accurate than traditional biochemical assays (MTT, WST1) which rely
- n indirect quantitation methods (cellular protein content).
Fixed or live cells (fluorescently tagged stable cell lines).
O hours 24 hours 48 hours
SLIDE 18 Quantitation of non-uniform cellular bodies
Quantitation of non-uniform actin rings following PDGF treatment. Measurements reflect the degree of ‘actin ring’ formation.
10’ PDGF
SLIDE 19
Protein Expression in Mouse Muscle Fibres
High-throughput screening of chemical library for compounds that upregulate expression of three genes of interest. 96 well plate format. Fibres stained with three fluorophores tagging proteins for quantitation. Analysis based on an object intensity multiplex.
SLIDE 20
Molecular Discovery Systems Lab G69, B Block QEII Medical Centre Hospital Avenue, Nedlands Australia 6009 Lab G69 Office Tel: +61 8 9346 7404 rachel@mdsystems.com.au