Chapter 3 Evaluating Process Capacity Process Flow Diagram - - PDF document

chapter 3 evaluating process capacity
SMART_READER_LITE
LIVE PREVIEW

Chapter 3 Evaluating Process Capacity Process Flow Diagram - - PDF document

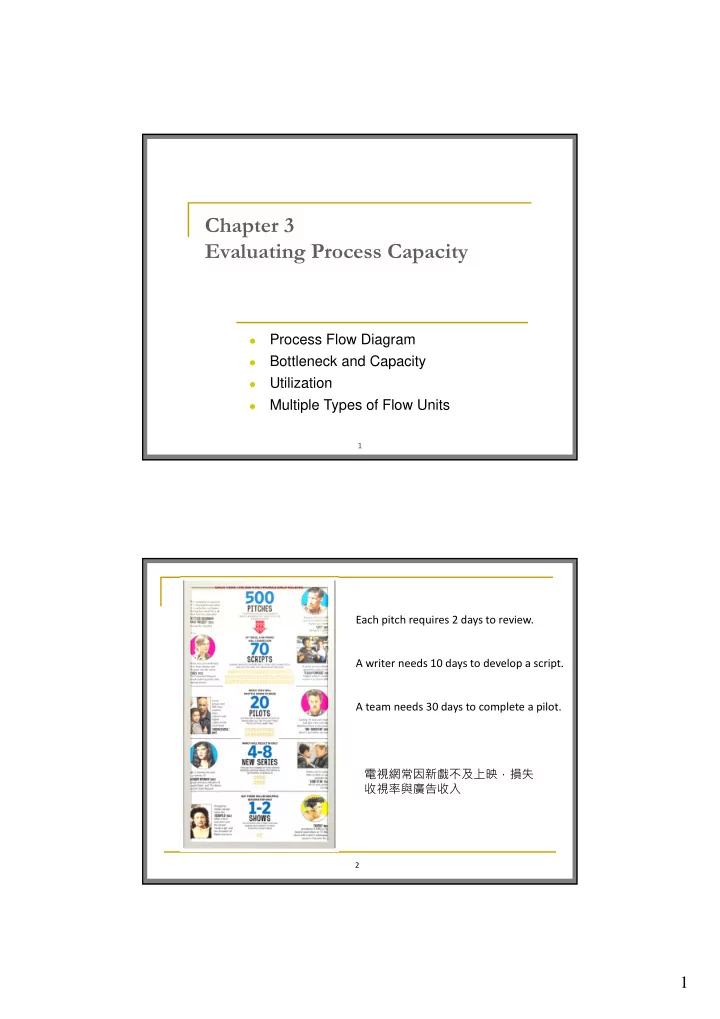
Chapter 3 Evaluating Process Capacity Process Flow Diagram Bottleneck and Capacity Utilization Multiple Types of Flow Units 1 Each pitch requires 2 days to review. A writer needs 10 days to develop a script. A team needs 30


slide-1
SLIDE 1

1

Chapter 3 Evaluating Process Capacity

1 

Process Flow Diagram

Bottleneck and Capacity

Utilization

Multiple Types of Flow Units

2

Each pitch requires 2 days to review. A writer needs 10 days to develop a script. A team needs 30 days to complete a pilot. 電視網常因新戲不及上映,損失 收視率與廣告收入

slide-2
SLIDE 2

2

Processes with Attrition Loss

3

Pitches Scripts Pilots New Series 2nd season 500 ideas per year

70 20 6 2 Processing time 2 days 10 days 30 days 70 days 200 days Resources 5 3 2 2 1 250 days judges script writers pilot teams series crews main crew per year

Where is the Bottleneck?

Basic Process Vocabulary

4

For each step of the process

 Activity times: how long does an operation (step) take?  Capacity: number of flow units processed per unit of time.

For the entire process

 Bottleneck: operation (step) with the lowest capacity  Process capacity: capacity of the bottleneck  Flow rate: rate at which flow units flow through the process  Utilization =Flow Rate / Capacity  Flow Time: amount of time it takes to go through the process

slide-3
SLIDE 3

3

3.1 The Circored Plant

5

converts iron ores into iron briquettes to supply steel plants

How to Draw a Process Flow Diagram

 Focus on one or two types of flow units.  Define the process boundaries and choose an appropriate

level of detail.

 Include only those steps that are likely to affect the process

flow or the economics of the process.

 Sizes and exact locations of arrows, boxes, and triangles do

not carry any special meaning.

 Use different colors for different routes.  Stay closer to the physical layout. 6

slide-4
SLIDE 4

4

Complete Process Flow Diagram

7

3.2 Resource and Process Capacity

8

How much a resource can serve in a given unit of time?

 Design Capacity

maximum amount of output w/o constraints

 Effective Capacity

maximum amount of output under maintenance, quality, and human constraints

 Best Operating Level

level of capacity at which average unit cost is minimized.

slide-5
SLIDE 5

5

Multiple Resources/Servers

9

 Activity time = T time units  Capacity of a single server =

  • units per time unit

 If a step has m identical servers in parallel  Capacity =

  • units per time unit

 Output 1 unit every

  • time units

Bottleneck and Process Capacity

 Process capacity is determined by the resource with the

smallest capacity.

 Flow rate = min{ available input, process capacity, demand } 10

input capacity demand input capacity demand input capacity demand

slide-6
SLIDE 6

6

Finding the Bottleneck in a Process

Stationary reactor

tons/hour 100 hours 4 tons 400 time flow WIP capacity   

11

Stationary reactor

12

Example: Bread Making and Packing

slide-7
SLIDE 7

7

3.3 Time to Process a Certain Amount of Supply

 Assuming the process is already producing output  If the process starts empty  Improving the bottleneck  Reducing time to serve X units

13

Time to serve X units = rate flow X Time to serve X units = total processing time + rate flow 1 ‐ X

3.4 Process Utilization and Capacity Utilization

capacity process rate flow capacity resource rate flow

14

 The objective of most businesses is to increase profit, not to

increase utilization. Process Utilization = Resource Utilization =

slide-8
SLIDE 8

8

Utilization with limited demand

 Assume the demand is only 657,000 tons.  The bottleneck is the resource with the highest

utilization.

15

3.5 Workload and Implied Utilization

 Utilization only carries information about excess capacity.  Implied utilization captures the mismatch when the demand

exceeds the capacity.

16

slide-9
SLIDE 9

9

Service Example: Driver’s License Office

17

 The office has 6 clerks, one for each step. The current capacity

is 60 applicants per hour.

 It is under pressure to increase its productivity to process 120

applicants per hour with the addition of only one clerk.

 Can rearrange steps 2‐4 in any order.

Check application Process payment Check for violations Conduct eye test Photograph applicant Issue new license 15 sec. 30 sec. 60 sec. 40 sec. 20 sec. 30 sec. 1 2 3 4 5 6

3.6 Multiple Types of Flow Units

 The flow may break up into multiple flows.  Different types of flow units move through the process. 18

slide-10
SLIDE 10

10

Bottleneck in the Multiproduct Process

 The product mix affects the process capacity.  Not all activities are required by all product type. 19 20

Economy of Scale

As the plant gets larger and production volume increases, the plant can fully utilize dedicated resources and thus reduce unit cost and selling price.

 Economy of Scale will backfire and incur huge loss if demand

cannot match capacity.

 The size of a plant may become too large and management,

material handling, or maintenance become a serious problem.

Larger Plant  Lower Cost  Lower Price  More Market Share

slide-11
SLIDE 11

11

Economy of Scale for Service Industry

 Chain stores lead to buying power.  Travel agencies buy airline tickets and hotel

rooms in bulks to get deeper discount.

 Small business can form an alliance to

increase the bargaining power against big suppliers.

21  Competing retail stores or restaurants located in the

same area may attract more consumers. 瑞豐night market

Summary

 World class enterprises excel at the speedy and flexible

integration of the business processes.

 Finding the bottleneck is the key to improve a variety of

performance measures.

22