Changes in global shipping and long-distance rail networks: possible - - PDF document

changes in global shipping and long distance rail
SMART_READER_LITE
LIVE PREVIEW

Changes in global shipping and long-distance rail networks: possible - - PDF document

Changes in global shipping and long-distance rail networks: possible impacts on hub port Singapore Theo Notteboom Foreign Expert/Full Professor, Dalian Maritime University, China Professor, ITMMA - University of Antwerp, Belgium Professor,


slide-1
SLIDE 1

1

Changes in global shipping and long-distance rail networks: possible impacts on hub port Singapore

Theo Notteboom

Foreign Expert/Full Professor, Dalian Maritime University, China Professor, ITMMA - University of Antwerp, Belgium Professor, Antwerp Maritime Academy, Belgium Council member and immediate past President, International Association of Maritime Economists (IAME) Co-Director Port Economics.eu

MPA Visiting Professor Public Lecture NTU - School of Civil & Environmental Engineering Singapore - February 5, 2015

2

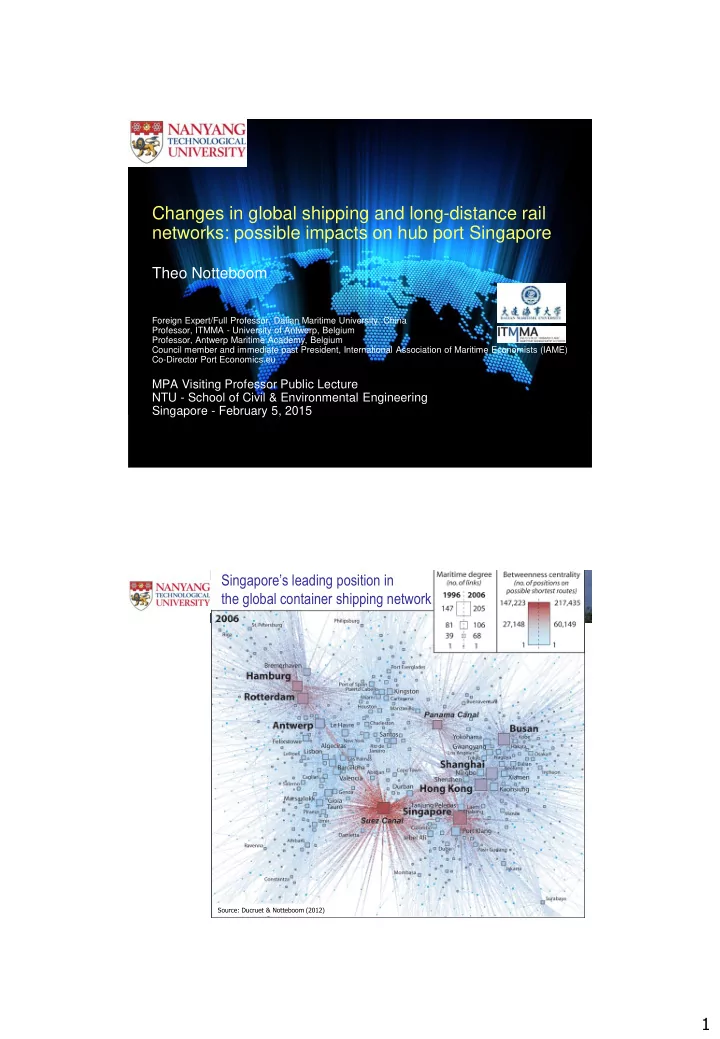
Source: Ducruet & Notteboom (2012)

Singapore’s leading position in the global container shipping network

slide-2
SLIDE 2

2 Maritime routes and strategic passages

Source: adapted from Rodrigue & Notteboom, 2013 = (interoceanic) passages = new / alternative shipping routes = landbridges (rail-based)

  • 1. THE ARCTIC SHIPPING ROUTES

4

12100 miles 9300 miles

slide-3
SLIDE 3

3

Monthly March ice extent for 1979 to 2014 shows a decline of 2.6% per decade relative to the 1981 to 2010 average.

5

Northern Sea Route (NSR) – fact sheet and prospects

6

slide-4
SLIDE 4

4

  • 2. THE SUEZ CANAL EXPANSION

7

Container ship traffic through the Suez Canal

8

slide-5
SLIDE 5

5

9

Suez Canal

Total length: 192 km, total width: 300 m, width between buoys: 180 m

There is one shipping lane with four passing areas.

The passage takes between 11 and 16 hours. Due to the limited width of the canal, ship convoys are formed on either side of the canal.

When a container vessel arrives late at the Canal, it misses the convoy of which it was planned to be part, leading to an additional waiting time of up to 12 hours.

Shipping lines reserve their place in a convoy and as such want to ensure that the vessel will make it in time to the Canal’s entrance.

Major expansion announced in August 2014

slide-6
SLIDE 6

6

Suez Canal expansion

11

  • New Canal of 37 km
  • Increase two-way traffic to 50%
  • Capacity from 49 now to 97 passing ships a day by 2023
  • Achieve direct unstopped transit for 45 ships in the two directions
  • Permissible draft to 66ft (24m) all through the Suez Canal
  • Transit time: from 18h to 11h (southbound convoy)
  • 3. THE PANAMA CANAL EXPANSION

12

slide-7
SLIDE 7

7

Container ship traffic through the Panama Canal

13 14

Current Panama Canal (www.pancanal.com)

Lengh canal: 80 km

(13.7 km in Gaillard cut)

Three lock systems Maximum dimensions:

 Beam: 32.31 m  LOA: 294.13 m  Draft: 12.04 m (39.5

feet)

slide-8
SLIDE 8

8

New Panama Canal locks (source: ACP)

15 16

slide-9
SLIDE 9

9

Current status

The Panama Canal expansion programme is 85% complete: completion scheduled for first months of 2016

Early January: the installation of the gates for the new locks of the Panama Canal has successfully begun on the Atlantic side of the waterway

In total, the new locks will have 16 rolling gates, eight in the Pacific and eight in the Atlantic.

17

Back to round-the-world services (RTW)?

18

Source: Ducruet & Notteboom (2011)

slide-10
SLIDE 10

10

Panama Canal and US East Coast ports?

“Panama Canal expansion boom might sail past US ports”, CNBC, 28 Oct 2013

Some 70 percent of all shipping cargo going through the canal comes to the U.S. coasts.

China's imports to the U.S. East Coast: only 20% through the Canal

Canal expansion could take some 35% of current West Coast freight

Baltimore, Miami, Jacksonville, Charleston, NY, etc..: multimillion-dollar efforts to increase their harbor capacity and local infrastructure.

But:

Unrealistic expectations

Many of these places don't have the distribution activity

19

Panama Canal and US East Coast ports?

Norfolk: only port on the East Coast able to handle the Post-Panamax ships

Charleston: $700 million in port-related infrastructure projects + an expected $1.3 billion—mostly federal aid—over the next 10 years.

Miami: four super-sized cranes+ $550 million for a tunnel to connect the port directly to a highway

New York/New Jersey: raising the Bayonne Bridge to allow the bigger ships to pass through to New Jersey's Port Newark => $ 1.3 billion and ready by 2017.

20

slide-11
SLIDE 11

11

21

The Resurgence of All Water Services to the US East Coast?

Landbridge Westbound und Route Eastbou

  • und

nd Route

Algeciras Gioia Tauro Jeddah Colombo Singapore Hong Kong Shanghai Pusan Kobe LA/LB Seattle / Vancouver

Panama Route

“China Effect” West Coast Congestion Landbridge Congestion Growth in the Southeast New Distribution Gateway

 

Source: Rodrigue & Guam (2007)

22

Challenges and Opportunities of the New Panama Canal

Westbound und Route Eastbou

  • und

nd Route

Algeciras Gioia Tauro Jeddah Colombo Singapore Hong Kong Shanghai Pusan Kobe LA/LB Kingston

Panama Suez

slide-12
SLIDE 12

12

The Nicaragua Canal: a ‘fata morgana’ or the emergence of a real local contender?

23

  • The Hong Kong-based HKND

Group has a 50-year concession to build and

  • perate the canal
  • Canal started construction in

late 2014

  • Project cost: US$50 billion

(estimated half of it for canal digging)

  • Completion by 2019
  • No real economic feasibility

study – only one academic paper 

  • Role of geopolitics? Return
  • n investment?
  • 4. THE SOUTH-SOUTH ROUTE

24

slide-13
SLIDE 13

13

The container port system in sub-saharan Africa

The Suez route (here via Algeciras) versus a potentially competing system for South Africa

Ngqura Algeciras

Dakar Douala Muqdisho Maputo Mumbai Calcutta Singapore Kaohsiung Shanghai Tokyo Jeddah Dubai Perth Georgetown Buenos Aires New York Houston

slide-14
SLIDE 14

14

Route competition analysis

The Suez route as competitor – summary graph for 2008

  • 40%
  • 30%
  • 20%
  • 10%

0% 10% 20% 30%

  • 40%
  • 30%
  • 20%
  • 10%

0% 10% 20% 30% 40% Average transit time difference (base = interlining via Algeciras) Average cost difference (base = interlining via Algeciras)

Interlining via SA takes less time and is cheaper than interlining via Algeciras Interlining via SA takes less time, but is more expensive than interlining via Algeciras Interlining via SA takes more time and is more expensive than interlining via Algeciras Interlining via SA takes more time, but is less expensive than interlining via Algeciras WAfrica-EAfrica WAfrica-India/Pak. SAmerEC-EAsia WAfrica-SEAsia WAfrica-EAsia SAmerEC-EAfrica SAmerEC-SEAsia SAmerEC-India/Pak. SAmerEC-MEast SAmerEC-Oceania WAfrica-Oceania = Pure interlining traffic = Interlining traffic, but hub-and- spoke solution (feeder) also possible = Area of strongest competition between Suez route and SA route

Estimation for year 2008

Route competition analysis

The Suez route as competitor – summary graph for 2020

  • 40%
  • 30%
  • 20%
  • 10%

0% 10% 20% 30% 40%

  • 40%
  • 30%
  • 20%
  • 10%

0% 10% 20% 30% 40% Average transit time difference (base = interlining via Algeciras) Average cost difference (base = interlining via Algeciras)

Interlining via SA takes less time and is cheaper than interlining via Algeciras Interlining via SA takes less time, but is more expensive than interlining via Algeciras Interlining via SA takes more time and is more expensive than interlining via Algeciras Interlining via SA takes more time, but is less expensive than interlining via Algeciras WAfrica-EAfrica WAfrica-India/Pak. SAmerEC-EAsia WAfrica-SEAsia WAfrica-EAsia SAmerEC-EAfrica SAmerEC-SEAsia SAmerEC-India/Pak. SAmerEC-MEast SAmerEC-Oceania WAfrica-Oceania = Pure interlining traffic = Interlining traffic, but hub-and- spoke solution (feeder) also possible = Area of strongest competition between Suez route and SA route

Estimation for year 2020

slide-15
SLIDE 15

15

Potential markets for the South-south route

Suez Canal Main port regions for intercontinental interlining/relay East-West mainline routes North-South and diagonal routes (mostly secondary) Market potential for the Cape route Cape

Brazil - Far East

111,531 TEU

Brazil – rest Asia

133,126 TEU

Brazil – India

18,068 TEU

Brazil – Oceania

14,739 TEU

Potential interlining via a regional hub (loaded containers only)

  • Excluding West Africa and East Africa (GTAP model, Lee et al., 2013)

Brazil - Far East

181,935 TEU

Brazil – rest Asia

187,915 TEU

Brazil – India

28,915 TEU

Brazil – Oceania

17,006 TEU Rest of South America – India 43,533 TEU Rest of South America – China 495,122 TEU Rest of South America – Rest Asia 391,313 TEU Rest of South America – Oceania 41,166 TEU

2020

Rest of South America – India 30,744 TEU Rest of South America – China 272,585 TEU Rest of South America – Rest Asia 252,776 TEU Rest of South America – Oceania 21,006 TEU

2015

Total

854574 TEU

Total

1386916 TEU

(Source; Flynn Consulting)

slide-16
SLIDE 16

16

  • 5. EURASIAN LANDBRIDGES

31

TEU Traffic on the Trans-Siberian Railway

(source: CCTT)

32

slide-17
SLIDE 17

17

The Trans-Siberian Railway

 Russia-China trade lane: about half of total

(about 420,000 TEU in 2014)

 Russian RZD plans to invest $6 billion by

2020

Average travel time will be less than eight days, with a speed of about 1200km a day (now 900 km per day)

 RZD has also plans to implement the

Hasan-Rajin project (Trans-Korean Railway see map).

33

Eurasian landbridges

January 2008 – “Beijing-Hamburg Container Express”

15 days to cover 6,200 miles

Through Mongolia, the Russian Federation, Belarus and Poland

34

January 2015 – Yiwu (Zhejiang Province) to Madrid

Longest rail link in the world

3 weeks to cover 8,111 miles to Madrid via Kazakhstan, Russia, Belarus, Poland, Germany and France

30 containers carrying 1,400 tons

Adding Spain to a route that already links Chongqing to Duisburg (and Rotterdam and Antwerp) five times a week.

Three transfers during the journey as a result

  • f incompatible rail gauges.
slide-18
SLIDE 18

18

New Silk Road and New Maritime Silk Road

(source: Xinhua net)

35

New Silk Road: some facts

Xi Jinping (November 8th 2014): $40 billion to “break the connectivity bottleneck” in Asia.

Central role for Kazakhstan (e.g. development of a dry port and rail yard at Khorgos, in the desert on its eastern border with China – open since late 2012)

In 2011 Kazakhstan, along with Russia and Belarus, formed a customs union

Transit time advantages:

Upper Yangtze to Europe by barge and ship: 50 to 60 days

Trains from Chongqing to Duisburg in Germany (10,800 km) via Kazakhstan, Russia, Belarus and Poland: 14 days (20 days in practice). Kazakhstan’s state-run railway, KTZ, promises to spend $44 billion over the next five years to make that ten days.

Cost disadvantages:

About $9,000-$10,000 one-way (one FEU)

Scale disadvantages:

Volume passing from China to Europe across Kazakhstan: 6,600 FEU in 2013 and 10,000 FEU in 2014

36

slide-19
SLIDE 19

19

Railways and proposed Kra Isthmus Canal (Thai Canal) in South Asia

37

  • 6. IMPLICATIONS FOR SINGAPORE

38

slide-20
SLIDE 20

20

A regional focus: the Americas, Europe and Africa

39  East Coast of the Americas:

Rising competition between Suez Canal, Panama Canal and Cape route

In distance terms (nm), Suez Canal and Cape remain best options for Singapore!

 Europe: NSR and landbridges will grow in significance, but..

Overall volumes will remain small compared to Suez route

Niche markets (high value products)

Main focus on flows orginating from North East Asia and West China

 Africa: embrace south-south route to reach West-Africa via Suez via Panama via Cape Singapore-Georgetown (Guyana) 10344 12119 10659 Singapore-Buenos Aires 12292 16042 9336 Singapore-New York 10201 12620 12439 Singapore-Houston 11762 12212 13165

Routes and passages matter.. But the impact on the configuration of port systems might matter even more

40

Inland focus of dominant (hub) port High Low High Dominant hub/gateway port

Transhipment hub and and multiple small feeder ports large gateway feeder ports

Port system's reliance on hub-and-spoke Single gateway system

Multiple gateway system

(sea-sea transhipment) Low 1 2 3 4

Source: adapted from Notteboom (2009)

Singapore = quadrant 2

slide-21
SLIDE 21

21

Factors with potentially high impact on arttractiveness of routes and port system configurations

Demand: trade flows between regions! => more direct calls?

Transit fees Canals:

Suez Canal and Panama Canal will become more expensive

Vessel sizes: differences between routes getting larger or smaller?

Bunker needs, bunker costs and associated slow steaming strategies?

Transit time and schedule integrity requirements of shippers?

Port efficiency/productivity, connectivity, flexibility and pricing? => the hub challenge

41

Thank you for your attention ! theo.notteboom@gmail.com www.porteconomics.eu