CB SAVE EARTH FUND Quarterly update 31 December 2014 3-year 5-year - - PowerPoint PPT Presentation

cb save earth fund
SMART_READER_LITE
LIVE PREVIEW

CB SAVE EARTH FUND Quarterly update 31 December 2014 3-year 5-year - - PowerPoint PPT Presentation

CB SAVE EARTH FUND Quarterly update 31 December 2014 3-year 5-year 10-year N/A Fund performance* and AUM NAV, 31 December 2014 (EUR) EUR SEK Class RC 13.04 Q4 2014 +2.9% +6.7% Class IC 12.68 +18.5% Year 2014 +11.0% Class ID


slide-1
SLIDE 1

Q4 2014 +2.9% Year 2014 +11.0% 5 yrs (annualised) +6.6% AUM (million) 15.70 Class RC 13.04 Class IC 12.68 Class ID 9.66

Fund performance* and AUM NAV, 31 December 2014 (EUR)

*Class RC N/A 3-year 5-year 10-year

EUR SEK

+6.7% +18.5% +4.9% 148.2.

CB SAVE EARTH FUND

Quarterly update 31 December 2014

slide-2
SLIDE 2

Save Earth Fund

The strategy and the team

  • A global environmental fund; three megatrends: renewable

energy, cleantech and water

  • Concentrated portfolio (6-10 funds)
  • Benchmark: MSCI World Net
  • Objective: Lower standard deviation than benchmark
  • Objective: Outperform benchmark over 12 months

About CB Save Earth Fund

  • Company founded in 1994
  • Family owned, acting under the supervision of the Swedish

Financial Supervisory Authority

  • Guidelines: active, ethical and long-term
  • An ethical framework is applied in the portfolio management
  • The team is based in Stockholm, Sweden; fund

administration is performed in Luxembourg

About CB Fonder The team

Carl Bernadotte

Portfolio Manager & owner >25 years’ experience Born 1955

Marcus Grimfors

Portfolio Manager 6 years’ experience Born 1981

Alexander Jansson

Portfolio Manager & CEO 6 years’ experience Born 1983

Erik Allenius Somnell

Business Development 3 years’ experience Born 1984

C B S AV E E AR T H FU N D

2

slide-3
SLIDE 3

Save Earth Fund

3

Cartoon of the quarter: Climate talks

A comment from The Economist on what can be expected during the important climate meeting in Paris 2015. The meeting is being held as a follow-up on the failed climate talks in Copenhagen 2009. There are hopes that an agreement (like the one in Kyoto 1997) could be made. The climate agreement in November between China and the US – the world’s two largest polluters – should hardly have worsened the odds for Paris…

Source: The Economist

C B S AV E E AR T H FU N D

slide-4
SLIDE 4

Save Earth Fund

4

The sector and the fund in media

The Swedish business paper Dagens Industri pay attention to climate and environmental funds because of their strong performance over the past year. More on the subject, together with some comments from Alexander Jansson, can be found by clicking

  • n the picture to the right (N.B. in Swedish).

Di, 5 December 2014 Financial Times published an award-winning article series on water shortages, which has become a global problem. The series highlights subjects such as the world’s largest infrastructure project in China; the leading technologies for improving the efficiency of water use; and the fact that 95% of California suffer from severe water stress. Read the series by clicking on the picture to the right. FT, Q3-Q4 2014 At the end of November E.ON, Germany’s largest power provider/distributor, announced that the company will be spilt in two: the new E.ON, with renewable energy and distribution as the main focus, and the old E.ON, to which all nuclear and fossil power production will be allocated. A sign of the times and something we believe we will see more of as the share of renewable energy increases at the expense of fossil energy. Read more by clicking on the picture to the right. The Economist, ”E.ON and E.OUT”, 6 December 2014

C B S AV E E AR T H FU N D

slide-5
SLIDE 5

Save Earth Fund

5

Performance: The fund and indices

  • Environmental investments have generally performed well over the past year, which has also been the case

for MSCI World, the latter driven by a strengthening US dollar as well as a strong performance for the US stock market.

  • The renewable energy index (Wilderhill New Energy Index), the most volatile sector in the comparison, had

a solid start of the year but fell back along with the oil price. Also the Cleantech index was curbed due to the

  • il price decline, while the water index is fairly uncorrelated with the oil price. Read more about the oil price
  • n page 8.
  • CB Save Earth Fund was +11% for the year. The fund has since inception in June 2008 performed better

than two out of the three sectors it invests in. At the same time, the risk for CB Save Earth Fund has been significantly lower than the risk in each of the three sectors, as well as the MSCI World index.

Source: MSCI, Reuters, Bloomberg, CB Fonder

+11.0% +19.5%

Return, sector indices, 1 year (EUR) Risk and return, sector indices, since fund inception (EUR) C B S AV E E AR T H FU N D

slide-6
SLIDE 6

6

Save Earth Fund

Performance: The fund and other global strategies

Source: CB Fonder, Lipper, Reuters, Bloomberg Daily data for the period 2011-12-31 – 2014-12-31 (EUR).

Risk and return, 3 years Risk-adjusted return (Sharpe ratio), 3 years

  • Our objective is for the fund to offer a green and global exposure and to be a competitive alternative

compared to other global funds. Over the last three years CB Save Earth Fund has stood up well, especially when looking at the risk-adjusted return (Sharpe ratio) compared to the global strategies of the most recognized names in the Nordic market.

  • Going forward, we believe that green investments can offer a window of growth and thus a better return than

the global stock market. Compare with emerging markets during the 2003-2007 period.

Standard Deviation Return p.a.

C B S AV E E AR T H FU N D

slide-7
SLIDE 7

Save Earth Fund

7

Source: CB Fonder, Bloomberg Daily data from Bloomberg for the period 2008-06-30 – 2014-12-31 (EUR).

Risk and return, since inception (EUR) Risk-adjusted return (Sharpe ratio), since inception

Performance: The fund and peers

  • CB Save Earth Fund’s objective is to offer investors a low risk alternative within a segment characterised

by high risk. The fund has, since inception in 2008, had a significantly lower risk than many competitors while delivering a highly competitive return; a combination that results in a high Sharpe ratio.

C B S AV E E AR T H FU N D

Standard Deviation Return p.a.

slide-8
SLIDE 8

Save Earth Fund

8

  • The oil price fell by 46%, in USD, during 2014, which had a big impact on many markets; in particular the ones directly

exposed (i.e. energy markets/companies).

  • A falling oil price is first and foremost negative for oil companies, but also companies in renewable energy is exposed due to

the decreasing incentives for substitution that comes with a lower oil price. We still believe in a strong long-term case for renewable energy, but we are cautious short term.

  • Our analysis show that the renewable energy sector historically has been hit hardest by a falling oil price, followed by
  • cleantech. The water sector, on the other hand, has consistently performed very well in relative terms. See the below table.
  • The unconstrained allocation mandate (between the sectors cleantech, water and renewable energy) for CB Save Earth

Fund allowed us to significantly reduce the exposure towards renewable energy already in October in favor of water and

  • cleantech. The oil price has since then fallen more than 40%. Today, renewable energy represent 1% of invested assets,

compared to 72% for water and 20% for the cleantech sector. See the current and historical allocation on page 11.

  • Read the analysis by clicking on the below picture.

What are the implications of a falling oil price on a green global equity fund?

The table shows the four largest drawdowns in the oil price (in USD)

  • ver the past decade, and the performance of each sector relative to

the MSCI World index over the same period. Source: MSCI, S&P, Reuters, Bloomberg, CB Fonder

Analysis: Implications of a falling oil price

C B S AV E E AR T H FU N D

slide-9
SLIDE 9

Save Earth Fund

Analysis: Active allocation

The returns differ significantly between the three sectors; active allocation matters

  • MSCI World is practically never the best performer; every year (with narrow exceptions in 2011 and 2014) a green sector

has given a greater return, why the prospects for active allocation are good.

  • Renewable energy, as a high-Beta sector, has very volatile returns: 2007 and 2013 were stellar years for the sector, while

2008, 2010, and 2011 were lousy. Cleantech has a somewhat similar return profile, but without the extremes.

  • Over the past 10 years the water sector has performed better or in line with the world index, which is why we argue that the

sector is an appropriate base in our portfolio – to which cleantech and renewable energy is added as compliments.

Source: Reuters, Bloomberg, S&P, MSCI, CB Fonder. Data as of 2014-12-31

Each sector’s excess return against the MSCI World index, per calendar year since 2005

9

C B S AV E E AR T H FU N D

slide-10
SLIDE 10

10

Save Earth Fund

The portfolio: Largest exposures

*Based on available data from underlying funds as of 2014-12-31.

C B S AV E E AR T H FU N D The 10 largest company exposures, as of 31 December 2014

  • Exposure to large companies with a

long history; no mayflies.

  • A mixture of high-yielding utilities

and growth companies.

  • For 2015, high profit growth is

expected, which gives attractive valuations: PEG ratio of 1.4.

  • Due to a concentrated

portfolio (6-10 managers; 6 as

  • f 31 December 2014) our

company exposures are fairly large.

Company Founded/listed Country Sector Market cap € bn Share of AUM* EPS growth 2015E PEG 2015 DY American Water 1886/2008 USA Water 8.2 2.4% 7.9% 2.6 2.5% Xylem 2011/2011 USA Water 5.4 2.0% 10.3% 1.6 1.6% Pentair 1966/1966 USA Water 10.3 1.8% 15.0% 1.0 2.0% A.O. Smith Corp 1874/1983 USA Water 4.8 1.8% 13.3% 1.5 1.1% Arcadis 1888/1995 Netherlands Cleantech 2.0 1.8% 16.9% 0.8 2.9% Andritz 1852/2001 Austria Renewables 4.7 1.8% 32.8% 0.5 3.1% Rexnord 1892/2012 USA Water 2.3 1.8% 14.1% 1.1 0.0% Danaher 1969/1979 USA Water 50.9 1.7% 10.3% 2.0 0.5% Pennon Group 1989/1989 UK Water 4.6 1.7% 16.7% 1.3 3.8% Suez Environnement 1858/2008 France Water 7.9 1.6% 15.9% 1.1 4.4% Total/Average 10.1 18.4% 15.3% 1.4 2.2%

slide-11
SLIDE 11

Save Earth Fund

11

The portfolio: Historical allocation, share of AUM

Sector allocation Geographical allocation

*Including cash in underlying funds. As of 2014-12-31 As of 2014-12-31

C B S AV E E AR T H FU N D

slide-12
SLIDE 12

Save Earth Fund

12

Risk profile: Standard deviation and Beta

*36 months data on a 60-day rolling basis (EUR)

Standard deviation* Beta against MSCI World*

15.3% 13.3% +0.79

C B S AV E E AR T H FU N D

The fund’s beta is consistently below 1 The fund’s standard deviation is consistently lower/in line with that

  • f the benchmark, MSCI World. This becomes particularly evident

when the risk in the market is rising, as has happened in the last quarter.

slide-13
SLIDE 13

1 2 3 4 5

Save Earth Fund

13

Source: MSCI, CB Fonder *Time period limited to date of fund inception in June 2008

The fund compared to MSCI World during the largest drawdowns (EUR)

The fund has consistently performed well compared to index (MSCI World) during drawdowns

Risk profile: The fund’s ability to preserve capital

*

C B S AV E E AR T H FU N D

  • Our objective is that the fund should be a low-risk alternative within a segment characterised by high risk;

we believe the performance of the fund in drawdowns to be a testament to this.

slide-14
SLIDE 14

Save Earth Fund

14

The investment case for CB Save Earth Fund

In the mirror – what has happened? In the crystal ball – what’s next?

C B S AV E E AR T H FU N D

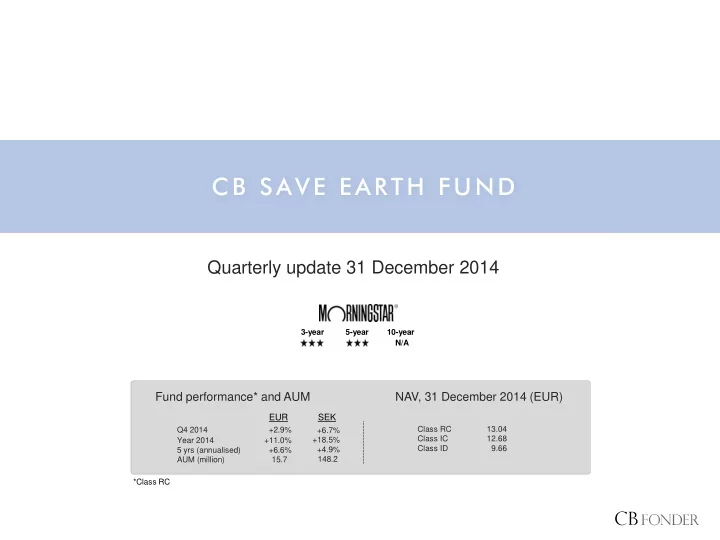
  • The fund returned +3% in EUR during the fourth quarter, which was better than two of the three sectors that the

fund invests in. The full year performance 2014 was +11%.

  • The oil price fell by 42% in the last quarter of 2014, which have had a negative effect on the renewable energy
  • sector. The unconstrained allocation mandate of the fund allowed us to significantly reduce our exposure towards

renewable energy in October in favor of water and cleantech; today, renewable energy represent 1% of the fund’s assets, compared to 72% for water and 20% for cleantech.

  • The fund offers a low-risk alternative in a segment characterized by high risk. Since inception in 2008 the fund's

risk level (standard deviation) has been significantly lower than that of environmental indices and peers, as well as the MSCI World index. The fund has also been competitive with other global funds during the last three years.

  • The fund’s assets increased by 39% in 2014 to EUR 15.7 million
  • We still believe in renewable energy as a long-term investment now that the sector has entered a phase with lower

subsidy dependence. We are, however, cautious short term due to the falling oil price, which reduces the incentives for substitution.

  • The water sector – the fund’s largest exposure (72%) – continues to perform in line with or better than the world

index e.g. due to the fact that there is no substitution for water, which suggests that this trend may continue for years to come. The sector resembles traditional sectors such as healthcare and consumer staples, both in terms of structural growth drivers and investment return.

  • The portfolio is exposed to high-yielding utilities and growth companies. The expected profit growth for the

underlying companies is attractive at +15% for 2015, compared to +8% for MSCI World.

  • We find the offering of a competitive global equity exposure without fossil energy increasingly interesting – with

holdings in structural growth sectors in a world that may face a prolonged period of weak growth. The fund also

  • ffers an opportunity for a yearly dividend of 6%, a low management fee and daily liquidity.
slide-15
SLIDE 15

Save Earth Fund

15

Share classes

C B S AV E E AR T H FU N D

CB Save Earth Fund, RC

  • Management fee:1.0%
  • Performance fee: No
  • Dividend: No
  • ISIN: LU0354788688

CB Save Earth Fund, IC

  • Management fee: 0.5%
  • Performance fee: 20% of return > MSCI World Net, with collective,

eternal and relative High-Water Mark

  • Dividend: No
  • ISIN: LU0354788506

CB Save Earth Fund, ID

  • Management fee: 0.5%
  • Performance fee: 20% of return > MSCI World Net, with collective,

eternal and relative High-Water Mark

  • Dividend: Yes, 6% of NAV yearly at end of October
  • ISIN: LU1053083884
slide-16
SLIDE 16

Save Earth Fund

C B S AV E E AR T H FU N D

Fund facts

16

  • Fund name:

CB Save Earth Fund

  • Manager:

CB Asset Management AB

  • Domicile:

Luxembourg

  • Custodian:

SEB Fund Service, Luxembourg

  • Auditor:

PricewaterhouseCoopers S.ár.I.

  • UCITS-classification:

UCITS IV

  • Currency:

EUR

  • Liquidity/NAV:

Daily/Daily

  • Subscription/redemption fee

RC/IC: No/No, ID: No/Yes*

  • Fund launch:

June 9, 2008

  • Minimum investment:

RC: None, IC/ID: €500 000

  • ISIN/Reuters/Bloomberg:

RC: LU0354788688 / 913218.FBF / CBSVERC LX IC: LU0354788506 / 68173241 / CBSICAE LX ID: LU1053083884 / N/A / CBIDLUX LX

*Max 1%, dependent on customer relationship

slide-17
SLIDE 17

Save Earth Fund

C B S AV E E AR T H FU N D

Appendix: Three megatrends

17

Water

  • Filtration
  • Saving/Efficiency
  • Infrastructure

Cleantech

  • Energy storage
  • Energy infrastructure
  • Energy efficiency
  • Transportation
  • Emissions control
  • Smart materials
  • Recycling & Waste treatment

Renewable energy

  • Wind
  • Solar
  • Hydro
  • Bio
  • Geothermal

C B S AV E E AR T H FU N D

slide-18
SLIDE 18

18

Save Earth Fund

18

Appendix: Multi-Manager

Source: Wikipedia

C B S AV E E AR T H FU N D

Every asset manager has a certain skill: one can be a specialist in Swedish Large Caps, another in Emerging Market high-yield debt. To be an expert in every field is hard if not impossible, and generally the complexity increases when analysing lesser developed markets, sectors or companies. Our ambition is to identify the managers that, over time, have performed best-in-class in each region and/or sector in order to deliver the best possible overall performance. To make a simple illustration of this point, we have made a comparison between the personal best marks of Carolina Klüft (successful Swedish heptathlon athlete) and the gold medallists' performance in each individual event in the 2012 London Olympics. Carolina’s performances are of course astonishingly good but can in no single event match that of the specialist. Multi-manager, or Fund of Funds, is in others words a method of identifying and selecting specialists with the ambition to deliver a consistently higher return: the whole is greater than the sum of the parts.

Gold, London 2012 Olympics 12.35 s 2.05 m 21.88 s 20.7 m 7.12 m 69.55 m 1:56.19 Carolina Klüft Personal best 13.15 s 1.95 m 22.98 s 15.05 m 6.97 m 50.96 m 2:08.9

slide-19
SLIDE 19

19

Save Earth Fund

19

Appendix: Environmental strategies as an asset class

C B S AV E E AR T H FU N D

  • The basic idea of a so called Core/Satellite strategy is to invest a large part of the portfolio in large caps with a

similar risk/return profile as the broad market (e.g. MSCI World) and to add smaller positions (10-20% of the portfolio) in niche strategies, so called satellites, with a different risk/return profile.

  • We argue that environmental strategies in the form of global stocks with strong long-term drivers and an

attractive and different risk/return profile, have the right characteristics to fit well in this type of strategy as a satellite/complement to the core in a global portfolio. Compare, for example, with the characteristics of emerging markets.

Environmental strategies as a complement to a global portfolio Large caps in developed markets Example of a Core/Satellite-portfolio

Bonds Environmental strategies Hedge funds EM HY Credit Real Estate

slide-20
SLIDE 20

20

Save Earth Fund

20

Appendix: Environmental strategies as an asset class

Environmental strategies as a complement to a global portfolio Risk and return, 10 years Risk and return, 2 years

Source: S&P, MSCI, Reuters, Bloomberg Monthly data for the period 2004-12-31 – 2014-12-31 (EUR).

C B S AV E E AR T H FU N D

  • The renewable energy index (NEXEUT) and the cleantech index (CTIUS) has clearly differing risk profiles compared to the

broad developed market indices (MSCI Europe, MSCI World and MSCI USA).

  • The water index (S&P Global Water Index), however, has a risk profile in line with the broad developed markets. Seen

from that perspective it can be argued that the sector is part of the core rather than the satellites.

slide-21
SLIDE 21

21

Save Earth Fund

The fund and benchmark indices, since inception June 2008 (EUR)

+71.6% +3.5% +82.2%

  • 40.8%

+30.4%

Appendix: The fund and benchmark indices

Source: MSCI, S&P, CB Fonder, Reuters, Bloomberg Daily data for the period 2008-06-09 – 2014-12-31

C B S AV E E AR T H FU N D

  • Index for renewable energy (including dividends):

WilderHill New Energy Global Innovation Index

  • Water index (including dividends): S&P Global Water Index
  • Index for cleantech: The Cleantech Index
  • World index (including dividends after tax): MSCI World
slide-22
SLIDE 22

Save Earth Fund

22

Disclaimer

C B S AV E E AR T H FU N D

This document is neither an offer to sell nor a solicitation to invest. Such offers or solicitations must be preceded or accompanied by a current offering document of the funds. This document is submitted to you confidentially solely in connection with your consideration of an investment in CB Save Earth Fund (the “Fund”). The preceding/upcoming pages constitute a summary

  • nly. No assurance can be given that the investment objective will be achieved, and investment

results may vary substantially over any given time period. Past performance is not necessarily indicative of future results. The fund involves a degree of risk. An investor in the fund could lose all or a substantial amount of his or her investment. The fund has fees that will reduce returns. The fund’s performance may be volatile.