SLIDE 19 19
Analysis: Adoption curves are not linear, they are exponential
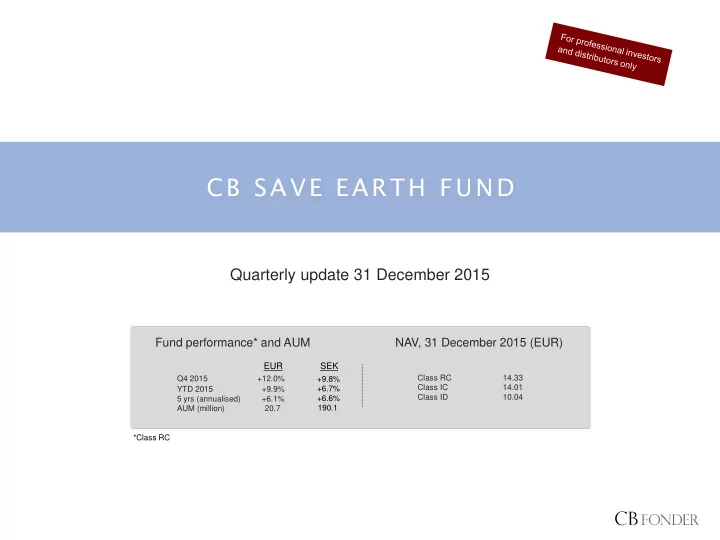
C B S A V E E A R T H F U N D
Source: Bernstein Research, CB Fonder
The price of solar energy (real, in $/MMBTU) has fallen sharply during the last years
figure illustrates the price development of the five different types of energy: Natural gas ("Henry Hub"), coal ("US Bitumous Coal"),
("Brent"), liquefied natural gas ("LNG") and solar energy ("solar").
- The price of solar energy has in recent
years fallen sharply and is now a competitive alternative to
more established forms of energy.
energy market is becoming technology-based, which implies that higher demand gives lower prices (comp. Moore’s law). A new world order...
- Most adoption curves are so-called S-
curves, which implies exponential rather than linear growth. When the new technology reaches 10% market share it’s game
the new technology substitutes the old one.
- Solar and wind currently accounts for a
small fraction of the global energy market (1.6%), but the proportion has increased 8x in 10 years. What is interesting is that solar and wind today represents more than 20% of the new capacity installed globally. Renewable energy is still marginal, but it begins to have a significant impact on the margin.
Solar and wind, percentage of the global energy market Adoption curves for colour TVs
% Source: Technology Futures, Inc Source: Bernstein Research, CB Fonder Source: Bernstein Research, CB Fonder