SLIDE 21 Analysis: Adoption curves are not linear, they are exponential
21
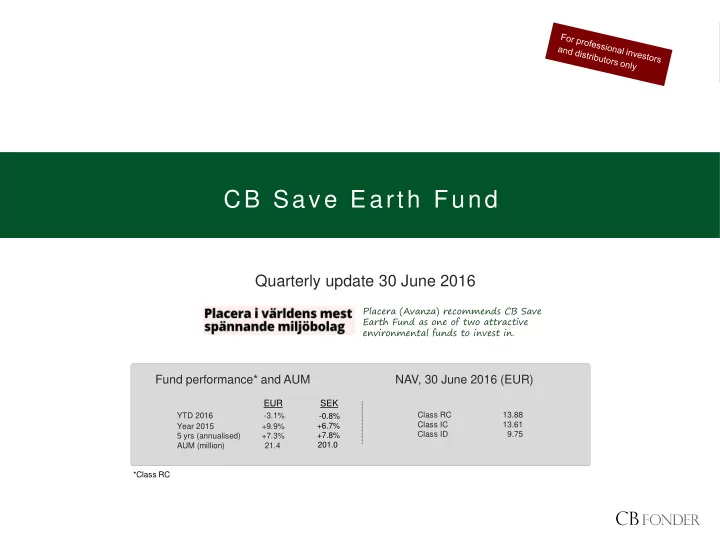
C B S A V E E A R T H F U N D
The price of solar panels and batteries follow the same learning curve
- The price of solar panels has fallen by
99% since 1976 and 80% since 2008. For each doubling in production, prices fall around 20% (Swanson’s law).
- Batteries follow the same curve as solar
panels and will see declining prices with an increase in demand, partially driven by electric cars.
energy market is becoming technology-based, which implies that higher demand gives lower prices (comp. Moore’s law).
- Most adoption curves are so-called S-
curves, which implies exponential rather than linear growth. When the new technology reaches 10% market share it’s game
the new technology substitutes the old one.
- History is filled with examples of shifts in
the technological landscape. They are impossible to predict but when they occur they are becoming more and more rapid. Renewable energy is still marginal, but history tells us that the shift in technology might happen quickly.
Adoption on the American market (as of 1997) Adoption curves for colour TVs
% Source: Technology Futures, Inc Source: Bloomberg New Energy Finance, Maycock, Battery University, MIIT Source: Forbes Magazine