Interim report, January-September 2017 Development in company - - PDF document

interim report january september 2017
SMART_READER_LITE
LIVE PREVIEW

Interim report, January-September 2017 Development in company - - PDF document

Interim report, January-September 2017 Development in company portfolio Sales unchanged EBITA amounted to SEK 1,006m (938), +7% Adjusted EBITA totalled SEK 1,045m (1,124), -7% Performance of Ratoss company portfolio 1) 1)


slide-1
SLIDE 1

Interim report, January-September 2017

Development in company portfolio

 Sales unchanged  EBITA amounted to SEK 1,006m (938), +7%  Adjusted EBITA totalled SEK 1,045m (1,124), -7%

Acquisitions and divestments

 Divestment of Nebula completed in the third quarter, exit gain SEK 515m  Divestment of Serena Properties completed in the third quarter, exit gain SEK 79m  GS-Hydro Holding Oy and GS-Hydro Oy were declared bankrupt in the third quarter  Divestment of the remaining shareholding in Arcus in the first quarter, exit gain SEK 33m  Divestment of AH Industries completed in the first quarter, exit loss SEK 32m

Financial information

 Consolidated net sales SEK 17,647m (18,579)  Profit before tax SEK 1,255m (-2,220)  Earnings per share before and after dilution SEK 2.73 (-5.74)  Redemption of all Class C preference shares, total redemption proceeds SEK 1,300m  Cash and cash equivalents in the parent company SEK 2,405m (1,627)

Performance of Ratos’s company portfolio1)

1)

2017 Q3 2016 Q3 Change 2017 Q1-3 2016 Q1-3 Change Net sales in the portfolio 4,861 5,096

  • 5%

15,874 15,821 0% EBITA in the portfolio 202 245

  • 18%

1,006 938 +7% Adjusted EBITA in the portfolio 2) 222 260

  • 15%

1,045 1,124

  • 7%

1) Comparison with corresponding period in preceding year pro forma. 2) Excluding items affecting comparability

For reconciliation of alternative performance measures, see Note 3

Ratos’s holding

Financial development based on financial IFRS

2017 2017 2016 2016 2017 2017 2016 2016 SEKm Q3 Q3 Q3 Q3 Q1-3 Q1-3 2016 2016 Net sales 5,344 6,305 17,647 18,579 25,228 Operating profit 816

  • 2,023

1,577

  • 1,786
  • 235

Profit before tax 741

  • 2,227

1,255

  • 2,220
  • 890
  • f which, Profit/share of profits in portfolio companies

90 149 725 332 295 Earnings per share before and after dilution 2.13

  • 5.34

2.73

  • 5.74
  • 1.79

Equity (attributable to owners of the parent) 10,225 10,279 11,283 Return on equity, %

  • 4

Equity ratio, % 46 42 45 Cash flow for the period from operating activities 284 377 1,451 Cash and cash equivalents in the parent company 2,405 1,627 2,677

slide-2
SLIDE 2

January-September Ratos interim report 2017 2

CEO comments on performance in the first nine months of 2017

Weak earnings require increased rate of improvement

The company portfolio showed improved earnings for the first nine months but sales and earnings weakened in the third quarter. We are continuing our collaboration with the companies to improve earnings levels and to create value. The Ratos Group’s profit before tax improved for the first nine months. The divestments of Nebula and Serena Properties, transactions with higher returns than our financial target, were completed in the third quarter and the exit gains from these divestments are included in profit for the period. In September, GS-Hydro was declared bankrupt. Although Ratos supported the company during a considerable period of time with action programmes and capital injections, we concluded it was no longer possible to reverse the trend.

Earnings trend

For the first nine months of 2017, the portfolio showed unchanged sales while EBITA rose 7% from SEK 938m to SEK 1,006m, pro forma and adjusted for Ratos’s holdings. Bisnode accounted for most of the EBITA improvement. In the third quarter of 2017, the portfolio showed a 5% decrease in sales, and EBITA declined 18%, from SEK 245m to SEK 202m, pro forma and adjusted for Ratos’s holdings. The weaker performance was mainly due to Diab, which faced a weak market combined with high commodity costs and negative currency effects. Also, Plantasjen has had a weaker development where a cold spring and summer has been countered by price cuts to manage stocks. TFS earnings were impacted by a lower service sales trend, negative currency effects and costs for

  • ngoing recruitments. Jøtul’s earnings improved due to

measures implemented to increase productivity and

  • perational efficiency.

The Ratos Group’s profit before tax totalled SEK 1,255m (-2,220) for the first nine months of 2017, and SEK 741m (-2,227) for the third quarter. In the third quarter of 2016, the impairment of book values affected the comparative figures. The earnings improvement includes total exit gains of SEK 594m from the divestments

  • f Nebula and Serena Properties.

Development in company portfolio

Several of our companies are continuously focusing on undertaking operational initiatives. HENT received a new

  • rder in Sweden and the order book is growing. During

the quarter, Plantasjen opened another small-format store in Norway. In the third quarter, Aibel was awarded a contract by Teekay to complete the production vessel Petrojarl I and Speed entered a collaboration agreement with Nefab, which offers complete packaging solutions. In September, Aibel’s three modules were successfully combined in the Johan Sverdrup project in Klosterfjorden, outside Haugesund. Important recruitments of senior key personnel are ongoing in Oase Outdoors, TFS and airteam to reinforce the organisations and enable expansion.

Divestments

In the third quarter, we completed the divestment of Nebula to Telia Company, which generated an exit gain of SEK 515m, an internal rate of return (IRR) of 37% and a money multiple of 3.3x. We also completed the divestment of Serena Properties to Fastighets AB Balder, which generated an exit gain of SEK 79m, an internal rate

  • f return (IRR) of 26% and a money multiple of 1.4x.

The trend and market outlook for GS-Hydro remained strained in the third quarter and the company was declared bankrupt in September. Together with the company’s Board and management, Ratos has implemented extensive action programmes in recent years, combined with considerable capital injections. Following a careful evaluation, however, we concluded that it was no longer possible to reverse the trend. The consolidated value of GS-Hydro had already been written down to zero.

Focus on earnings and development

In the third quarter, the portfolio’s earnings performance was unsatisfactory. To achieve higher earnings, we need to continue increasing the rate of improvement. Operational management costs are continuing to decline and we estimate that the cost level is about SEK 150m on a yearly basis. We see a continued strong transaction market with good opportunities for Ratos to benefit from our unique profile, flexible ownership horizon and clear investment

  • strategy. Our current cash and bank balance provides

readiness and opportunities to act. Magnus Agervald, Chief Executive Officer

slide-3
SLIDE 3

January-September Ratos interim report 2017 3

Important events, January-September 2017

Third quarter

 GS-Hydro Holding Oy and its subsidiary GS-Hydro Oy were declared bankrupt following a decision by the company’s Board to file a bankruptcy petition in the Tavastia Proper District Court in September, after consultation with Ratos and GS-Hydro’s lenders. The company’s situation is mainly due to a weak trend and substantial price pressure in the offshore market, combined with an insufficiently competitive market

  • position. The bankruptcy had a marginal effect on
  • earnings. In July, Ratos provided GS-Hydro with a

previously agreed capital injection of EUR 2m.  In July, Ratos paid an additional purchase consideration

  • f EUR 8.3m in relation to TFS.

Second quarter

 Ratos’s Annual General Meeting on 6 April approved a dividend of SEK 2.00 per ordinary share, totaling SEK 638m, which was paid in April.  In May, Ratos’s Board of Directors resolved to carry out a compulsory redemption of all Class C preference shares for total redemption proceeds of SEK 1,300m. Following the redemption of all 830,000 Class C preference shares, the total number of shares in Ratos was 324,140,896, of which 84,637,060 were Class A shares and 239,503,836 Class B shares.  In June, Ratos completed the divestment of Sophion Bioscience, the final remaining business area in its subsidiary Biolin Scientific. The divestment was covered by Chapter 16 of the Swedish Companies Act (so-called Leo provisions) and was approved by an extraordinary general meeting of Ratos’s shareholders on 14 June. The divestment generated no significant exit gain for Ratos.  In May, Ratos entered into an agreement to divest its subsidiary Nebula to Telia Company. The transaction was completed in July. The selling price for 100% of the shares (equity value) amounted to EUR 110m (approximately SEK 1.1 billion) and the enterprise value to EUR 165m. Ratos’s share of the equity value was EUR 78m (SEK 752m) and the exit gain totalled SEK 515m. The divestment generated an IRR of about 37% and a money multiple of 3.3x.  At its capital markets day in June, Ratos presented an updated strategic agenda. Through increased value creation and higher performance levels in the portfolio companies, Ratos’s long-term ambition is to lay the foundation for a larger proportion of cash-flow- generated financing of the future dividends on Ratos’s

  • shares. The investment interval for new investments has

also been updated. The goal for new acquisitions is that the company in question must have a minimum growth potential of SEK 0.5 billion in equity value over the next five years. The upper investment interval has been lowered from SEK 5 billion to SEK 2 billion in equity value to create better balance and risk spread in the portfolio. Ratos has chosen six sectors on which it will focus its acquisition and business development efforts going forward. Central management costs will be reduced through internal efficiency measures.  In June, Ratos signed an agreement to divest all of its shares in its subsidiary Serena Properties to Fastighets AB Balder for an enterprise value of EUR 206m (approximately SEK 2 billion). Ratos received EUR 50.4m (SEK 481m) for its shareholding. The divestment generated an exit gain of SEK 79m, an internal rate of return (IRR) of 26% and a money multiple of 1.4x. The divestment was completed in September.  In June, Ratos contributed SEK 55m to HL Display in

  • rder to create scope for continued expansion.

First quarter

 In February, Ledil was refinanced. Ratos received a dividend of EUR 18m for its holding of 66%.  In March, Bisnode entered into an agreement to acquire Global Group Dialog Solutions AG. The acquisition was completed in April. Ratos contributed SEK 54m, corresponding to its holding.  In March, Ratos divested its remaining shareholding of 23.6% in Arcus to Canica AS and Sundt AS. Arcus was listed on the Oslo Stock Exchange in December 2016 and generated a total exit gain of SEK 1,437m, an IRR of 30% and a money multiple of 5.7x in SEK (6.2x in NOK).  In March, Plantasjen signed an agreement to acquire SABA Blommor AB. The acquisition was completed in the second quarter and was financed by Plantasjen. Refer to pages 6-11 for more information about significant events in the companies. Complete income statements, statements of financial position and statements of cash flows for all companies are available at www.ratos.se.

slide-4
SLIDE 4

January-September Ratos interim report 2017 4

Companies overview

The Ratos Group’s net sales for the first nine months of 2017 in accordance with IFRS amounted to SEK 17,647m (18,579). Operating profit for the same period totalled SEK 1,577m (-1,786). To facilitate a comparison of the ongoing performance of Ratos’s company portfolio, the section below presents certain financial information that is not defined in accordance with IFRS. For a reconciliation of the alternative performance measures used in this report with the most directly reconcilable IFRS measures, refer to Note 3.

Ratos’s company portfolio

Ratos invests mainly in unlisted medium-sized Nordic companies and has 14 companies in its portfolio. The largest industries in terms of sales are Industrials, Consumer goods/Commerce and Construction.

14 14 companies with approximately 13 13,40 ,400* 0* employees

* The number of employees is based on the average number of employees for full-year 2016 for the 14 companies. Sal ales b s bre reak akdown wn by seg segment ment**

** Adjusted for the size of Ratos’s holdings.

BUSINESS SERVICE 2% Speed Group CONSTRUCTION 27% HENT, airteam CONSUMER GOODS/COMMERCE 27% Plantasjen, Gudrun Sjödén Group, Jøtul, Oase Outdoors HEALTHCARE 2% TFS INDUSTRIALS 29% Aibel, Diab, HL Display, Ledil TECHNOLOGY, MEDIA, TELECOM 13% Bisnode, KVD

slide-5
SLIDE 5

January-September Ratos interim report 2017 5

Ratos’s companies

Q3 2017

Sal ales t s tre rend EBITA ITA* EBITA ITA ma margin

* Adjusted for the size of Ratos’s holdings. The information presented for each company starting on page 6 refers to the company in its entirety and has not been adjusted for the size of Ratos’s holding.

  • 30
  • 25
  • 20
  • 15
  • 10
  • 5

5 10 15 20 %

  • 20
  • 10

10 20 30 40 50 60 70 2016 2017 MSEK

  • 15
  • 10
  • 5

5 10 15 20 25 30 35 2016 2017 %

slide-6
SLIDE 6

January-September Ratos interim report 2017 6

Consumer goods/Commerce

Plantasjen

 Sales growth and the EBITA margin were adversely impacted by colder weather in the third quarter and a weak spring season, which was countered by a price cut to manage stocks. SABA Blommor contributed to growth, growth in comparable units remained unchanged  Plantasjen is strengthening its organization with the ambition to start-up e-commerce in 2018  In the third quarter, one new small-format store was

  • pened in Norway

 Daniel Juhlin has been appointed new CEO of

  • Plantasjen. Daniel’s most recent position was as CEO of

Byggmax AB, a part of Byggmax Group AB. He will take up his position in early December

Plantasjen is the Nordic region’s leading chain for sales of plants and gardening accessories with more than 120 stores in Norway, Sweden and Finland and a primary focus on consumers. Holding

99 99%

Gudrun Sjödén Group

 Sales growth of 13% during the quarter, positive growth in all markets, particularly via e-commerce  Stronger EBITA margin due to increased sales  Continued focus on global expansion and development

  • f e-commerce

International design company with a unique, colourful style and a clear sustainability profile. Holding

30 30%

MNOK 2017 2017 2016 2016 2017 2017 2016 2016 Sales 872 795 3,127 2,986 EBITA

  • 7

21 321 346 EBITA margin

  • 0.8%

2.7% 10.3% 11.6% Cash flow from

  • perations
  • 215

253 Q1-3 Q3 Q3 MSEK 2017 2017 2016 2016 2017 2017 2016 2016 Sales 208 184 579 512 EBITA 31 25 59 45 EBITA margin 15.0% 13.8% 10.1% 8.8% Cash flow from

  • perations

30 50 Q1-3 Q3 Q3

slide-7
SLIDE 7

January-September Ratos interim report 2017 7

Jøtul

 Positive sales trend in the third quarter, including the peak-season months of August and September. Demand continued to improve in the two core markets of North America and France, while the Nordic region and other markets showed a weaker trend  The initiative to improve productivity and operational efficiency began to yield results, which is reflected by the EBITA improvement. A lower capacity utilization compared with the year-earlier period had a negative impact on earnings  On 1 October, Nils Agnar Brunborg was appointed new

  • CEO. Nils Agnar has been Acting CEO since January

2017.

The Norwegian company Jøtul is a global supplier of fireplaces with its main production facilities in Norway and Denmark. Holding

93 93%

Oase Outdoors

 Stable sales in the third quarter despite negative currency effects. Planned investments in growth initiatives and product development led to higher expenses, which had a negative impact on EBITA. Non- recurring costs in the third quarter of 2016 amounted to DKK 12m  Growth initiatives in the organisation with recruitments in several key functions, including business development, purchasing and sales

Danish company that develops, produces and sells high-quality camping and outdoor equipment. Holding

78 78% Construction

HENT

 As expected, sales declined 10% in the third quarter following a strong 2016. High profitability continued  A weak cash flow during the quarter, attributable to substantial trade receivables received after the end of the quarter due to calendar effects  Order intake of about NOK 1.1 billion in the third

  • quarter. New order, including construction of offices for

Jernhusen in Malmö (approx. SEK 220m). At 30 September 2017, the order book was approximately NOK 10.2 billion (approximately NOK 8.9 billion at 31 December 2016)  In its property development operations, HENT has signed an agreement for a new project in Trondheim. The operations now have a total of six projects comprising more than 1,500 apartments, in which HENT’s average holding is nearly 50%

HENT is a leading Norwegian construction contractor with projects in Norway and

  • Sweden. The company focuses on newbuilds of

public and commercial real estate, and focuses its resources on project development, project management and procurement. The projects are largely carried out by a broad network of quality-assured subcontractors. Holding

73 73%

MNOK 2017 2017 2016 2016 2017 2017 2016 2016 Sales 228 216 610 593 EBITA 13 3

  • 15
  • 19

EBITA margin 5.8% 1.5%

  • 2.4%
  • 3.1%

Cash flow from

  • perations
  • 25
  • 80

Q1-3 Q3 Q3 MDKK 2017 2017 2016 2016 2017 2017 2016 2016 Sales 68 68 306 324 EBITA 2

  • 6

57 59 EBITA margin 3.6%

  • 8.3%

18.5% 18.0% Cash flow from

  • perations

74 70 Q1-3 Q3 Q3 MNOK 2017 2017 2016 2016 2017 2017 2016 2016 Sales 1,718 1,902 5,140 5,802 EBITA 65 49 184 180 EBITA margin 3.8% 2.6% 3.6% 3.1% Cash flow from

  • perations
  • 340
  • 358

Q1-3 Q3 Q3

slide-8
SLIDE 8

January-September Ratos interim report 2017 8

airteam

 High sales growth and level of market activity. airteam is a project-based operation, in which sales and profitability vary between periods. Slightly stronger profitability compared with the year-earlier period due to successful project execution. Transaction-related and

  • ther non-recurring costs of DKK 3m were charged to

EBITA in the third quarter of 2016  Organisational investment and intense focus on growth initiatives to enable expansion continued

airteam offers high-quality, effective ventilation solutions in Denmark. Holding

70 70% Industrials

Aibel

 Sales declined in Modifications and Yards in the third quarter, while the performance of Field Development improved, driven by the Johan Sverdrup contract. Stable profitability in the current project portfolio  At 30 September 2017, the value of the order book was approximately NOK 11 billion, down 27% compared with 30 September 2016  In August, Aibel was awarded an FPSO* contract by Teekay to complete the production vessel Petrojarl I. The contract includes testing the vessel’s onboard

  • system. The work will be carried out in the Haugesund

shipyard  In September, Aibel’s three modules were successfully combined in the Johan Sverdrup project in Klosterfjorden, north of Haugesund, outside Aibel’s

  • shipyard. After assembly, the combined platform was

transferred to the shipyard where the final installations will be carried out. In summer 2018, the completed platform will be handed over to Statoil for transport to the North Sea

*FPSO: Floating Production Storage and Offloading Aibel is a leading Norwegian supplier of maintenance and modification services (Modification and Yards) for production platforms and onshore installations for oil and gas as well as new construction projects (Field Development) in oil and gas and renewable energy (Renewables). The company has

  • perations along the Norwegian coast and in
  • Asia. Customers are primarily the major oil

companies operating on the Norwegian continental shelf. Holding

32 32%

MDKK 2017 2017 2016 2016 2017 2017 2016 2016 Sales 158 149 467 421 EBITA 17 10 39 21 EBITA margin 10.8% 6.5% 8.3% 5.0% Cash flow from

  • perations

16 39 Q1-3 Q3 Q3 MNOK 2017 2017 2016 2016 2017 2017 2016 2016 Sales 1,823 2,432 6,657 7,356 EBITA 63 90 258 140 EBITA margin 3.4% 3.7% 3.9% 1.9% Cash flow from

  • perations
  • 233

346 Q1-3 Q3 Q3

slide-9
SLIDE 9

January-September Ratos interim report 2017 9

Diab

 Sales decline due to a weaker trend in the wind power segment, while the marine segment delivered a strong performance  The weak EBITA was due to lower sales, impairment of accounts receivable, sharply increased commodity costs and negative currency effects  An action programme is ongoing to counteract the weak market trend. Continued high commodity prices, a weaker market and negative currency effects is expected to have an adverse impact during the rest of the year

Diab is a global company that develops, manufactures and sells core materials for sandwich composite structures including blades for wind turbines, hulls and decks for leisure boats, and components for aircraft, trains, industrial applications and buildings. The core materials have a unique combination of characteristics such as low weight, high strength, insulation properties and chemical resistance. Holding

96 96%

HL Display

 Sales declined 4% in the third quarter, mainly due to lower sales in the UK  A lower EBITA margin due to lower sales, higher logistics costs and mix effects  Continued focus on product innovation, a broader offer and efficiency improvements

HL Display is an international supplier of products and systems for merchandising and in- store communication with operations in 47

  • markets. Manufacturing takes place in Poland,

Sweden, China and the UK. Holding

99 99%

Ledil

 Sales growth primarily driven by the European market, which is Ledil’s largest market  Changed assessment has resulted in Ledil capitalising its product tools, which had a positive impact of a total of EUR 0.4m on the EBITA margin for the quarter compared with the year-earlier period. Previous periods in 2017 are pro forma in relation to the changed assessment  Continued robust sales and product development initiatives

Ledil is a Finnish leading global player within secondary optics for LED lighting. The products are sold by the company’s own sales force as well as via agents and distributors in Europe, North America and Asia. Production is carried

  • ut by subcontractors in Finland and China.

Holding

66 66%

MSEK 2017 2017 2016 2016 2017 2017 2016 2016 Sales 342 350 1,140 1,126 EBITA

  • 6

23 34 81 EBITA margin

  • 1.8%

6.7% 3.0% 7.2% Cash flow from

  • perations
  • 8

11 Q1-3 Q3 Q3 MSEK 2017 2017 2016 2016 2017 2017 2016 2016 Sales 353 368 1,087 1,044 EBITA 18 27 43 56 EBITA margin 5.2% 7.4% 4.0% 5.4% Cash flow from

  • perations

15

  • 40

Q1-3 Q3 Q3 MEUR 2017 2017 2016 2016 2017 2017 2016 2016 Sales 10.8 10.5 31.1 29.3 EBITA 3.5 3.2 9.5 9.5 EBITA margin 32.6% 30.9% 30.5% 32.2% Cash flow from

  • perations

3.9 6.9 Q1-3 Q3 Q3

slide-10
SLIDE 10

January-September Ratos interim report 2017 10

Technology, Media, Telecom

Bisnode

 Sales rose 5% in the third quarter compared with the year-earlier quarter, organic currency-adjusted growth was 1%, due to a positive trend in Sweden and DACH*. To date this year, the organic and currency-adjusted growth rate is 1%  EBITA improved SEK 23m, of which SEK 14m was attributable to non-recurring costs in the third quarter

  • f 2016 related to the restructuring process, primarily

layoffs.  The extensive change initiatives to strengthen the core business and modernise the customer offering are being carried out at a high pace

Bisnode is a leading European data and analysis

  • company. The customer base comprises

companies and organisations in Europe which use Bisnode’s services to convert data into knowledge for both day-to-day issues and major strategic decisions. Holding

70 70%

* DACH; Germany, Switzerland, Austria

Kvdbil

 During the quarter, growth was driven by good development in all three segments – Private Cars, Company Cars and Machines & Heavy Vehicles. Marketing and IT costs had a negative impact on EBITA. Non-recurring costs in the third quarter of 2016 amounted to SEK 6m  Continued investment in IT and the development of services in order to raise the level of customer value on auction sites

Kvdbil is Sweden’s largest independent online marketplace offering broker services for second-hand vehicles. The company operates the auction sites kvd.se, kvdnorge.no, kvdpro.com and kvdauctions.com, where cars, heavy vehicles and machines are offered for sale at weekly online auctions. The number of unique visitors totals approximately 200,000 per week. The company’s service offering includes valuation portals for cars. Holding

100 100%

MSEK 2017 2017 2016 2016 2017 2017 2016 2016 Sales 833 793 2,603 2,493 EBITA 85 62 254 115 EBITA margin 10.2% 7.8% 9.8% 4.6% Cash flow from

  • perations

26 270 Q1-3 Q3 Q3 MSEK 2017 2017 2016 2016 2017 2017 2016 2016 Sales 82 71 253 236 EBITA 8 6 25 24 EBITA margin 9.6% 8.8% 9.9% 10.3% Cash flow from

  • perations

6 13 Q1-3 Q3 Q3

slide-11
SLIDE 11

January-September Ratos interim report 2017 11

Healthcare

TFS

 In the third quarter, service sales* amounted to EUR 13.9m (13.9), which was in line with the year- earlier period. Negative organic service sales growth due to cancellations of a number of major customer

  • projects. Weak order intake to date this year

 EBITA was adversely impacted by cancelled customer projects, a number of senior recruitments and high negative currency effects. Non-recurring costs had a total impact of EUR 0.7m on EBITA, partly related to acquisition costs and the change of CEO  During the quarter, Daniel Spasic stepped down from his position as CEO and James Utterback was appointed Acting CEO. Recruitment of a new CEO is ongoing

* According to IFRS, TFS and other contract research organizations

(CRO) generate two types of revenue: 1) service sales (actual revenue-generating sales) and 2) re-invoicing of expenditure (for example, travel expenses, laboratory costs and other overheads) at no or a very low margin. In all material respects, service sales are the most important when it comes to the company’s performance and earnings. TFS performs clinical trials in the human phase

  • n behalf of the pharmaceutical, biotechnology

and medical device industries. Holding

60 60% Business services

Speed Group

 Weaker sales and lower margin, mainly attributable to a modified contract portfolio. Investments completed in process and system improvements creates an attractive customer offering and facilitate future growth  The collaboration agreement signed in the second quarter with Luna AB, part of B&B Tools, related to logistics management means that Speed, as the first Nordic 3PL* player, will be investing in a fully automated warehouse solution from Autostore. Cash flow was impacted by investment in the warehouse solution from Autostore  In the third quarter, a collaboration agreement was signed with Nefab, which offers complete packaging solutions that reduce customers’ overall costs and environmental impact

Speed Group is a Swedish provider of services that extend from staffing and recruitment to full- scale warehouse management, as well as production and education. Holding

70 70%

* Third-party logistics MEUR 2017 2017 2016 2016 2017 2017 2016 2016 Sales 22.9 20.1 66.2 59.0 EBITA

  • 1.0

1.6 0.2 4.3 EBITA margin

  • 4.5%

8.0% 0.4% 7.2% Cash flow from

  • perations
  • 0.4

0.5 Q1-3 Q3 Q3 MSEK 2017 2017 2016 2016 2017 2017 2016 2016 Sales 126 141 382 426 EBITA 10 18 24 39 EBITA margin 8.1% 12.4% 6.3% 9.2% Cash flow from

  • perations
  • 70
  • 10

Q1-3 Q3 Q3

slide-12
SLIDE 12

January-September Ratos interim report 2017 12

Ratos’s companies, adjusted for the size Ratos’s holdings

A) EBITA, adjusted for non-recurring items. B) Cash flow from operations, excluding paid tax and interest, but including investments and divestments of intangible assets and property, plant and equipment, respectively. All figures in the above table are based on Ratos’s holdings. In order to facilitate comparisons between years and provide a comparable structure, where appropriate some holdings are reported pro forma. Pro formas are presented below.

  • 1. airteam’s earnings for 2016 are pro forma in terms of Ratos’s acquisitions, and for new financing and Group structure.
  • 2. Gudrun Sjödén Group’s earnings for 2016 are pro forma in terms of Ratos’s acquisition.
  • 3. Ledil’s earnings for 2017 are pro forma in terms of the changed assessment under IFRS, which has led to the capitalisation of Ledil’s product tools and

accordingly, an EBITA improvement of SEK 2.5m for the third quarter, and SEK 11.5m for the first nine months of 2017. No pro forma figures were calculated for 2016.

  • 4. Oase Outdoors’ earnings for 2016 are pro forma in terms of Ratos’s acquisition and for new financing and Group structure.
  • 5. Plantasjen’s earnings for 2016 are pro forma in terms of Ratos’s acquisition and for new financing and Group structure.

Complete income statements, statements of financial position and statements of cash flows for all the companies are available at www.ratos.se.

SEKm 2017 Q3 2016 Q3 2017 Q1-3 2016 Q1-3 2016 2017 Q3 2016 Q3 2017 Q1-3 2016 Q1-3 2016 Aibel 591 795 2,203 2,346 3,474 20 29 85 45 15 airteam 1) 141 133 419 368 535 15 9 35 18 32 Bisnode 582 554 1,819 1,742 2,416 60 43 178 80 159 Diab 328 337 1,095 1,081 1,456

  • 6

22 33 77 105 Gudrun Sjödén Group 2) 62 55 174 154 214 9 8 18 14 21 HENT 1,280 1,423 3,891 4,232 5,829 49 37 139 131 174 HL Display 347 362 1,071 1,029 1,397 18 27 43 56 66 Jøtul 216 204 587 549 832 13 3

  • 14
  • 17

KVD 82 71 253 236 321 8 6 25 24 37 Ledil 3) 68 66 197 182 242 22 20 60 59 70 Oase Outdoors 4) 68 69 309 320 331 2

  • 5

57 58 36 Plantasjen 5) 876 814 3,209 2,953 3,656

  • 10

25 330 343 230 Speed Group 88 99 267 298 393 7 12 17 27 24 TFS 131 114 380 331 475

  • 6

9 1 24 38 Total adjusted for Ratos’s holding 4,861 5,096 15,874 15,821 21,570 202 202 245 245 1,006 938 938 1,009 Change

  • 5%

+0%

  • 18%

+7% Net sales in portfolio EBITA in portfolio Cash flow from

  • perations in

portfolio B) Interest-bearing net debt in portfolio Ratos's holding (%) SEKm 2017 Q3 2016 Q3 2017 Q1-3 2016 Q1-3 2016 2017 Q1-3 17-09-30 17-09-30 Aibel 28 10 93 91 100 114 761 32 airteam 1) 15 11 35 37 52 35 101 70 Bisnode 64 57 187 139 250 189 1,162 70 Diab

  • 6

22 33 82 110 11 856 96 Gudrun Sjödén Group 2) 9 8 18 14 21 15

  • 21

30 HENT 49 37 139 132 175

  • 271
  • 205

73 HL Display 20 32 45 66 84

  • 39

551 99 Jøtul 13 4

  • 10
  • 13

7

  • 77

547 93 KVD 8 12 27 35 48 13 147 100 Ledil 3) 22 20 60 59 70 44 226 66 Oase Outdoors 4) 2 7 57 74 57 70 165 78 Plantasjen 5)

  • 8

18 339 357 296 260 2,202 99 Speed Group 7 12 17 27 29

  • 7
  • 12

70 TFS

  • 2

9 6 24 40 3 28 60 Total adjusted for Ratos’s holding 222 222 260 260 1,045 1,124 1,337 360 360 6,508 Change

  • 15%
  • 7%

Adjusted EBITA in portfolio A)

A)

slide-13
SLIDE 13

January-September Ratos interim report 2017 13

Financial information

Ratos’s results

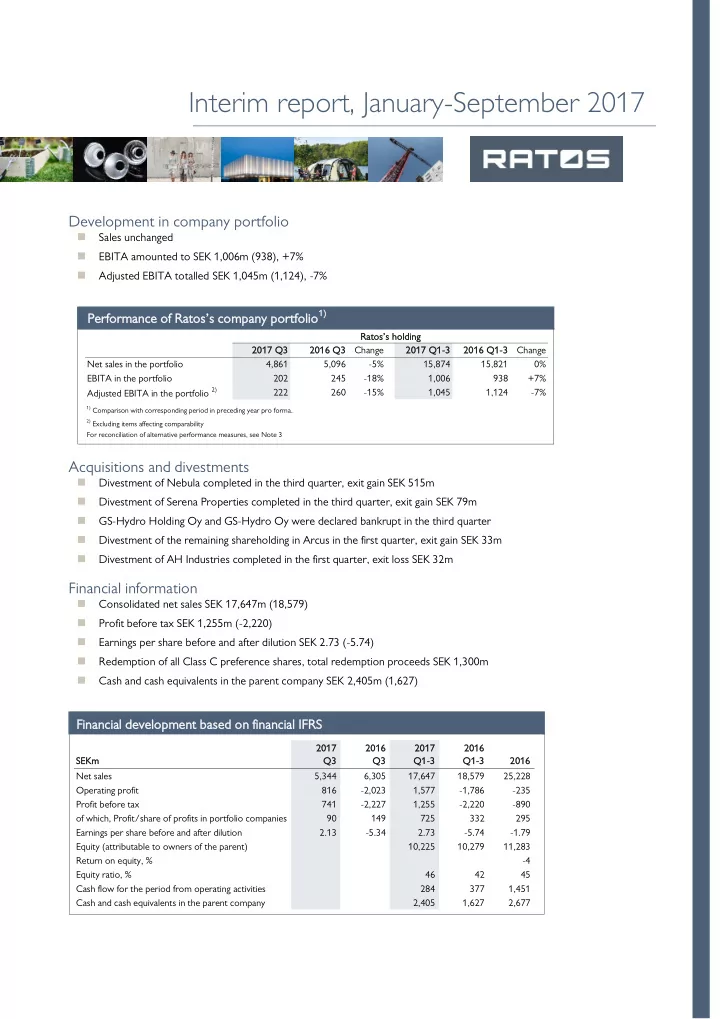
Profit before tax for the first nine months of 2017 totalled SEK 1,255m (-2,220). In 2016, earnings were charged with impairment losses of SEK 2,301m. In 2017, earnings include exit gains totalling SEK 594m from Nebula and Serena Properties. This result includes profit/share of profits from the companies of SEK 725m (332). The improvement is attributable to a changed company portfolio with earnings from the companies acquired in 2016: airteam, Gudrun Sjöden Group, Oase Outdoors and Plantasjen, improved earnings in Bisnode and a reduction in non-recurring items. Ratos’s operational management costs amounted to SEK -115m (-195). In 2016, costs included organisational changes including the change of CEO. Refer to Note 5 for more details about Ratos’s results.

Cash flow and financial position

Cash flow for the period was SEK -854m (-2,892), of which cash flow from operating activities accounted for SEK 284m (377), cash flow from investing activities for SEK 1,251m (-2,389) and cash flow from financing activities for SEK -2,388m (-880). In addition to the conditions in the portfolio companies’ operating activities, Ratos’s cash flow was impacted by changes in the company portfolio. At the end of the period, the Group’s cash and cash equivalents amounted to SEK 3,537m (3,752) and interest-bearing net debt totalled SEK 4,115m (5,275).

Ratos’s equity

At 30 September 2017, Ratos’s equity (attributable to

  • wners of the parent) amounted to SEK 10,225m

(SEK 9,550m at 30 June 2017), corresponding to SEK 32 per share outstanding (SEK 30 at 30 June 2017).

Parent company

Operating loss totalled SEK -116m (-202). In 2016, earnings were impacted by higher personnel costs due to

  • rganisational changes. The parent company’s profit

before tax amounted to SEK 1,101m (-1,156). In 2016, earnings included impairment of shares in subsidiaries. The parent company’s cash and cash equivalents totalled SEK 2,405m (1,627).

Ratos’s Class B share

Earnings per share before dilution amounted to SEK 2.73 (-5.74). At 30 September, the closing price for Ratos’s Class B shares was SEK 39.86. The total return on Class B shares for the first nine months of 2017 amounted to -3%, compared with the performance for the SIX Return Index, which was 13%.

Redemption of Ratos’s preference shares

On 16 May 2017, the Board of Directors of Ratos AB resolved on a compulsory redemption of all Class C preference shares. In accordance with the redemption provision in Article 6, item 5 of the Articles of Association, the Board also decided to reduce the company’s share capital by SEK 2,614,500 in conjunction with the redemption of its 830,000 preference shares. The total redemption proceeds for the 707,408 Class C preference shares outstanding amounted to SEK 1,300m, corresponding to SEK 1,837.50 per preference share. Payment of the redemption proceeds took place on 16 June 2017. Prior to redemption, dividends on Class C preference shares were paid as follows: With a record date of 15 February 2017, SEK 18m was paid on 20 February 2017. With a record date of 15 May 2017, SEK 21m was paid on 18 May 2017.

Treasury shares and number of shares

No Class B shares were repurchased and no call options were exercised during the period. At the end of September, Ratos owned 5,126,262 Class B shares (corresponding to 1.6% of the total number of shares), repurchased at an average price of SEK 68. At 30 September, the total number of shares in Ratos (Class A and B shares) amounted to 324,140,896 and the number of votes to 108,587,444. The number of

  • utstanding Class A and B shares was 319,014,634. The

average number of Class B treasury shares in Ratos in the first nine months of 2017 was 5,126,262 (5,126,468 in full- year 2016).

Credit facilities and new issue mandate

The parent company has a credit facility of SEK 2.2 billion including a bank overdraft facility. The purpose of the facility is to be able to use it when bridge financing is required for acquisitions and to be able to finance dividends and day-to-day running costs in periods with few

  • r no exits. The parent company should normally be
  • unleveraged. The credit facility was unutilised at the end of

the period. In addition, there is also a mandate from the 2017 Annual General Meeting to issue a maximum of 35 million Ratos Class B shares in conjunction with agreements on acquisitions and an authorisation to issue a maximum total of 1,250,000 Class C and/or Class D preference shares in conjunction with acquisitions.

Other

In accordance with a policy for the appointment of a Nomination Committee adopted by Ratos’s AGM in 2016, the company’s major shareholders/owners appointed, from among their number, a Nomination Committee with the Chairman of the Board Jonas Wiström as convener.

slide-14
SLIDE 14

January-September Ratos interim report 2017 14

Ragnar Söderberg (Ragnar Söderberg Foundation and related parties’ holdings) was appointed Chairman. Other members are: Jan Söderberg (own and related parties’ holdings), Maria Söderberg (Torsten Söderberg Foundation and own holding), Erik Brändström (Spiltan Fonder AB), Håkan Roos (Roosgruppen AB) and Jonas Wiström (Chairman of Ratos’s Board). Ratos’s Annual General Meeting will be held on 3 May 2018 at Skandiascenen, Cirkus, in Stockholm, Sweden.

Key figures for Ratos’s share

SEKm 2017 Q1-3 2016 Q1-3 2016 2016 Key figures per share 1)

1)

Total return, %

  • 3
  • 11
  • 6

Dividend yield, % 4.6 Market price, SEK 39.86 40.74 43.14 Dividend, SEK 2.00 Equity attributable to owners of the parent, SEK 2) 32 28 31 Earnings per share before and after dilution, SEK 3) 2.73

  • 5.74
  • 1.79

Average number of ordinary shares outstanding: – before dilution 319,014,634 319,014,358 319,014,428 – after dilution 319,014,634 319,014,358 319,014,428 Total number of registered shares 324,140,896 324,970,896 324,970,896 Number of shares outstanding 319,014,634 319,722,795 319,722,042 – of which, Class A shares 84,637,060 84,637,060 84,637,060 – of which, Class B shares 234,377,574 234,377,574 234,377,574 – of which, Class C shares 708,161 707,408

1) Relates to Class B shares unless specified otherwise. 2) Equity attributable to owners of the parent divided by the number of outstanding ordinary shares at the end of the period. Comparison periods

have been adjusted for outstanding preference share capital. All preference shares were redeemed by the end of the second quarter 2017.

3) Profit for the period attributable to owners of the parent minus dividend for the period on preference shares divided by the average number of

  • utstanding ordinary shares.
slide-15
SLIDE 15

January-September Ratos interim report 2017 15

Financial statements

Consolidated income statement

SEKm 2017 Q3 2016 Q3 2017 Q1-3 2016 Q1-3 2016 2016 Net sales 5,344 6,305 17,647 18,579 25,228 Other operating income 30 11 70 32 88 Change in inventories of products in progress, finished goods and work in progress

  • 17
  • 8

12 43 7 Work performed by the company for its own use and capitalised 14 18 46 58 90 Raw materials and consumables

  • 2,878
  • 3,478
  • 9,267
  • 10,070
  • 13,695

Employee benefit costs

  • 1,394
  • 1,608
  • 4,570
  • 5,073
  • 6,807

Depreciation/amortisation and impairment of property, plant and equipment and intangible assets

  • 143
  • 765
  • 456
  • 1,029
  • 1,441

Other costs

  • 773
  • 806
  • 2,586
  • 2,563
  • 3,539

Capital gain/loss from group companies 583 7 559

  • 2

1,678 Impairment and capital gain from investments recognised according to the equity method 79

  • 1,692

112

  • 1,692
  • 1,692

Share of pre-tax profit/loss from investments recognised according to the equity method 1)

  • 29
  • 6

11

  • 69
  • 152

Operating profit/loss 816 816

  • 2,023

1,577

  • 1,786
  • 235

Financial income 15 16 56 55 96 Financial expenses

  • 89
  • 221
  • 378
  • 489
  • 751

Net financial items

  • 74
  • 205
  • 322
  • 434
  • 655

Profit/loss before tax 741 741

  • 2,227

1,255

  • 2,220
  • 890

Tax

  • 46
  • 52
  • 218
  • 138
  • 198

Share of tax from investments recognised according to the equity method 1) 8 5

  • 4

18 18 Profit/loss for the period 703 703

  • 2,274

1,032

  • 2,340
  • 1,071

Profit/loss for the period attributable to: Owners of the parent 681

  • 1,687

910

  • 1,778
  • 500

Non-controlling interests 22

  • 587

123

  • 563
  • 570

Earnings per share, SEK – before dilution 2.13

  • 5.34

2.73

  • 5.74
  • 1.79

– after dilution 2.13

  • 5.34

2.73

  • 5.74
  • 1.79

1) Tax attributable to shares of profit/loss before tax from investments recognised according to the equity method are presented on a separate line.

slide-16
SLIDE 16

January-September Ratos interim report 2017 16

Consolidated statement of comprehensive income

SEKm 2017 Q3 2016 Q3 2017 Q1-3 2016 Q1-3 2016 2016 Profit/loss for the period 703 703

  • 2,274

1,032

  • 2,340
  • 1,071

Other comprehensive income Items that will not be reclassified to profit or loss: Remeasurement of defined benefit pension obligations, net

  • 87
  • 87
  • 70

Tax attributable to items that will not be reclassified to profit or loss 21 21 18

  • 66
  • 66
  • 51

Items that may be reclassified subsequently to profit or loss: Translation differences for the period 19 327

  • 103

653 312 Change in hedging reserve for the period

  • 12

5

  • 25

7

  • 54

Tax attributable to items that may be reclassified subsequently to profit or loss 2

  • 1

5

  • 2

9 9 331 331

  • 123

657 657 268 268 Other comprehensive income for the period 9 264 264

  • 123

591 591 216 216 Total comprehensive income for the period 712 712

  • 2,009

910 910

  • 1,749
  • 854

Total comprehensive income for the period attributable to: Owners of the parent 674

  • 1,506

809

  • 1,367
  • 388

Non-controlling interest 39

  • 503

101

  • 381
  • 466
slide-17
SLIDE 17

January-September Ratos interim report 2017 17

Summary consolidated statement of financial position

SEKm 2017-09-30 2016-09-30 2016-12-31 ASSETS Non-current assets Goodwill 12,061 13,588 12,990 Other intangible non-current assets 1,855 1,862 1,844 Property, plant and equipment 1,773 1,838 1,970 Financial assets 1,387 1,839 2,373 Deferred tax assets 466 593 594 Total non-current assets 17,543 19,721 19,771 Current assets Inventories 1,140 2,104 1,389 Current receivables 3,931 4,956 3,771 Cash and cash equivalents 3,537 3,752 4,389 Assets held for sale 8 485 Total current assets 8,608 10,819 10,034 Total assets 26,151 30,540 29,805 EQUITY AND LIABILITIES Equity including non-controlling interests 12,069 12,733 13,286 Non-current liabilities Interest-bearing liabilities 5,639 7,058 6,953 Non-interest bearing liabilities 373 383 582 Pension provisions 494 568 487 Other provisions 79 114 99 Deferred tax liabilities 542 531 501 Total non-current liabilities 7,126 8,653 8,623 Current liabilities Interest-bearing liabilities 1,637 1,717 1,228 Non-interest bearing liabilities 4,641 6,889 5,630 Provisions 678 547 553 Liabilities attributable to Assets held for sale 485 Total current liabilities 6,956 9,154 7,896 Total equity and liabilities 26,151 30,540 29,805

slide-18
SLIDE 18

January-September Ratos interim report 2017 18

Summary statement of changes in consolidated equity

SEKm Owners of the parent Non- controlling interest Total equity Owners of the parent Non- controlling interest Total equity Owners of the parent Non- controlling interest Total equity Opening equity 11,283 2,003 13,286 12,882 2,419 15,302 12,882 2,419 15,302 Adjustment

  • 25
  • 5
  • 30
  • 35
  • 10
  • 46

Adjusted equity 11,283 2,003 13,286 12,858 2,414 15,272 12,847 2,409 15,256 Total comprehensive income for the period 809 101 910

  • 1,367
  • 381
  • 1,749
  • 388
  • 466
  • 854

Dividends

  • 659
  • 90
  • 749
  • 1,108
  • 22
  • 1,130
  • 1,108
  • 22
  • 1,131

Non-controlling interests’ share of capital contribution and new issue 28 28 477 477 494 494 Purchase/redemption of treasury shares, net effect

  • 1,300
  • 1,300
  • 60
  • 60
  • 61
  • 61

Option premiums 1 1 2 2 2 2 Put options, future acquisitions from non-controlling interests

  • 6
  • 6
  • 4
  • 15
  • 19
  • 4
  • 38
  • 42

Acquisition of shares in subsidiaries from non-controlling interests 1

  • 5
  • 5
  • 41
  • 18
  • 59
  • 6
  • 55
  • 60

Disposal of shares in subsidiaries to non-controlling interests 4 4 Non-controlling interests at acquisition

  • 1
  • 1

8 8 Non-controlling interests in disposals

  • 102
  • 102
  • 63
  • 63

Adjusted non-controlling interests 91

  • 91
  • 264
  • 264

Closing equity 10,225 1,843 12,069 10,279 2,454 12,733 11,283 2,003 13,286 2017-09-30 2016-09-30 2016-12-31

slide-19
SLIDE 19

January-September Ratos interim report 2017 19

Consolidated statement of cash flows

SEKm 2017 Q1-3 2016 Q1-3 2016 2016 Operating activities Profit/loss before tax 1,577

  • 1,786
  • 235

Adjustment for non-cash items

  • 114

2,955 1,784 1,463 1,169 1,549 Income tax paid

  • 126
  • 201
  • 232

Cash flow from operating activities before change in working capital 1,337 968 968 1,317 Cash flow from change in working capital Increase (-)/Decrease (+) in inventories

  • 42
  • 98
  • 47

Increase (-)/Decrease (+) in operating receivables

  • 443

462

  • 118

Increase (+)/Decrease (-) in operating liabilities

  • 568
  • 955

299 Cash flow from operating activities 284 284 377 377 1,451 Investing activities Acquisition, group companies

  • 353
  • 1,187
  • 2,242

Disposal, group companies 707

  • 2

1,757 Acquisitions, investments recognised according to the equity method

  • 16
  • 585
  • 585

Disposals, investments recognised according to the equity method 1,005 Purchase and disposal, intangible assets/property, plant and equipment

  • 372
  • 369
  • 529

Investments and disposal, financial assets 272

  • 256
  • 257

Received interest 8 10 13 Cash flow from investing activities 1,251

  • 2,389
  • 1,844

Financing activities Non-controlling interests' share of issue/capital contribution 41 280 298 Purchase/redemption of treasury shares

  • 1,300
  • 60
  • 62

Option premiums paid 18 55 66 Redemption of options

  • 5
  • 9
  • 11

Acquisition and disposal of shares in subsidiaries from non-controlling interests

  • 58
  • 96

Dividends paid

  • 677
  • 1,091
  • 1,109

Dividends paid, non-controlling interests

  • 90
  • 28
  • 28

Borrowings 624 1,600 3,376 Amortisation of loans

  • 722
  • 1,352
  • 3,903

Paid interest

  • 254
  • 186
  • 284

Amortisation of finanicial lease liabilitities

  • 22
  • 32
  • 41

Cash flow from financing activities

  • 2,388
  • 880
  • 1,794

Cash flow for the period

  • 854
  • 2,892
  • 2,187

Cash and cash equivalents at the beginning of the year 4,389 6,455 6,455 Exchange differences in cash and cash equivalents

  • 30

174 138 Increase (-)/Decrease (+) of cash and cash equivalents classified as Assets held for sale 32 15

  • 17

Cash and cash equivalents at the end of the period 3,537 3,752 4,389

slide-20
SLIDE 20

January-September Ratos interim report 2017 20

Parent company income statement Parent company statement of comprehensive income

SEKm 2017 Q3 2016 Q3 2017 Q1-3 2016 Q1-3 2016 2016 Other operating income 12 1 14 2 2 Other external costs

  • 16
  • 19
  • 54
  • 60
  • 81

Personnel costs

  • 18
  • 35
  • 73
  • 141
  • 184

Depreciation of property, plant and equipment

  • 1
  • 1
  • 2
  • 3
  • 4

Operating loss

  • 23
  • 54
  • 116
  • 202
  • 266

Gain from sale of participating interests in group companies

  • 3

1,304

  • 3

1,304 2,459 Dividends from group companies 572 Impairment of shares in group companies

  • 2,241
  • 123
  • 2,241
  • 2,467

Gain from sale of interests in associates 778 Result from other securities and receivables accounted for as non- current assets 2 Other interest income and similar profit/loss items 7 2 13 23 14 Interest expenses and similar profit/loss items

  • 3
  • 19
  • 22
  • 40
  • 52

Profit/loss after financial items

  • 22
  • 1,008

1,101

  • 1,156
  • 312

Tax Profit/loss for the period

  • 22
  • 1,008

1,101

  • 1,156
  • 312

SEKm 2017 Q3 2016 Q3 2017 Q1-3 2016 Q1-3 2016 2016 Profit/loss for the period

  • 22
  • 1,008

1,101

  • 1,156
  • 312

Total comprehensive income for the period

  • 22
  • 1,008

1,101

  • 1,156
  • 312
slide-21
SLIDE 21

January-September Ratos interim report 2017 21

Summary parent company balance sheet Summary statement of changes in parent company’s equity

SEKm 2017-09-30 2016-09-30 2016-12-31 ASSETS Non-current assets Property, plant and equipment 62 64 64 Financial assets 9,282 7,913 9,075 Total non-current assets 9,344 7,978 9,139 Current assets Current receivables 28 59 51 Cash and cash equivalents 2,405 1,627 2,677 Total current assets 2,433 1,686 2,728 Total assets 11,776 9,664 11,867 EQUITY AND LIABILITIES Equity 8,375 8,390 9,232 Non-current provisions Other provisions 11 11 Non-current liablities Interest-bearing liabilities, group companies 818 875 2,254 Non-interest bearing liabilities 19 42 34 Other financial liabilities 41 22 39 Current provisions 124 169 117 Current liabilities Interest-bearing liabilities, group companies 743 Non-interest bearing liabilities, group companies 1,581 5 16 Non-interest bearing liabilities 75 151 165 Total equity and liabilities 11,776 9,664 11,867 SEKm 2017-09-30 2016-09-30 2016-12-31 Opening equity 9,232 10,711 10,711 Comprehensive income for the period 1,101

  • 1,156
  • 312

Dividends

  • 659
  • 1,108
  • 1,108

Purchase/redemption of treasury shares, net effect

  • 1,300
  • 60
  • 61

Option premiums 1 2 2 Closing equity 8,375 8,390 9,232

slide-22
SLIDE 22

January-September Ratos interim report 2017 22

Parent company cash flow statement

SEKm 2017 Q1-3 2016 Q1-3 2016 2016 Operating activities Profit/loss before tax 1,101

  • 1,156
  • 312

Adjustment for non-cash items

  • 1,025

1,013 143 76

  • 143
  • 169

Income tax paid Cash flow from operating activities before change in working capital 76 76

  • 143
  • 169

Cash flow from change in working capital: Increase (-)/Decrease (+) in operating receivables

  • 11
  • 14
  • 4

Increase (+)/Decrease (-) in operating liabilities

  • 72
  • 44
  • 28

Cash flow from operating activities

  • 7
  • 7
  • 200
  • 201

Investing activities Investment, shares in subsidiaries

  • 292
  • 1,740
  • 3,198

Disposal, shares in subsidiaries 20 1,196 Liabilities to group companies 1) 1,228 1,364 Disposal, shares in associates 781 Acquisition, property, plant and equipment

  • 1

Investment and disposal, financial assets

  • 20
  • 4

Cash flow from investing activities 1,697

  • 1,720
  • 643

Financing activities Purchase/redemption of treasury shares

  • 1,300
  • 60
  • 62

Option premiums paid 3 3 6 Dividends paid

  • 677
  • 1,091
  • 1,109

Cash flow from financing activities

  • 1,974
  • 1,149
  • 1,165

Cash flow for the period

  • 284
  • 3,069
  • 2,009

Cash and cash equivalents at the beginning of the year 2,677 4,677 4,677 Exchange differences in cash and cash equivalents 11 19 9 Cash and cash equivalents at the end of the period 2,405 1,627 2,677

1) Liability to centrally administered group company that arose in conjunction with divestment of group company.

slide-23
SLIDE 23

January-September Ratos interim report 2017 23

Not

  • te 1

e 1 Ac Accou count nting p ing principles inciples

Ratos’s consolidated financial statements are prepared in accordance with International Financial Reporting Standards (IFRS) and associated interpretations (IFRIC), as endorsed by the EU. This interim report was prepared in accordance with IAS 34, Interim Financial Reporting, and applicable provisions in the Swedish Annual Accounts Act. The parent company also applies RFR 2 Accounting for Legal Entities. Reporting and measurement principles are unchanged compared with those applied in Ratos’s 2016 Annual Report. The following change has been made to the presentation format. Amend mended prese senta ntati tion

  • n for

form m for for the the consol

  • nsolidated

ted sta stateme tement nt of

  • f cash

sh fl flows

  • ws

To more clearly separate cash flows arising in operations conducted and the cash flows that relate to the financing of such operations, interest paid and interest received, which were previously included in operating activities, have been moved to financing activities (interest paid) and investing activities (interest received). Consequently, cash flow is based on operating profit instead of profit before tax, which was used in the past. IF IFRS 15 Reve venue fr nue from

  • m Contr
  • ntracts wi

ts with th Customer ustomers IFRS 15 will be applied from 2018 and addresses the recognition of revenue from contracts with customers and the sale of certain non- financial assets. The standard will replace IAS 11 Construction Contracts and IAS 18 Revenue and their related interpretations. Since Ratos’s subsidiaries operate in a variety of sectors, they will be affected to different degrees by the new rules. In 2016, Ratos’s companies commenced a review of their respective types of revenue and analysed whether the new rules in IFRS 15 will affect revenue recognition when the standard takes effect. This work has continued in 2017 and in-depth analyses have been conducted in a few companies. The previous preliminary conclusion, that the transition to IFRS 15 would not have any significant effects on the Ratos Group’s financial earnings and position, has been strengthened. The ongoing work is mainly focused on presentation and disclosure issues, and implementation.

Not

  • te 2

e 2 Ris Risks ks and and u uncer ncertain tainties ties

Ratos invests in and develops unlisted enterprises in the Nordic region. These operations include inherent risks attributable to both Ratos and the companies. These mainly comprise market, operational and transaction risks and can include both general risks, such as external factors and macroeconomic development, as well as company and sector-specific risks. Ratos’s future earnings development is dependent to a large extent on the success and returns of the underlying companies which is also dependent, among other things, on how successful those responsible for the investments and each company’s management group and board are at developing and implementing value-enhancing initiatives. Ratos is also exposed to various types of financial risks, primarily related to loans, trade receivables, trade payables and derivative

  • instruments. The financial risks consist of financing risk, interest rate risk,

credit risk and currency risk. It is also essential that Ratos has the ability to attract and retain employees with the right skills and experience. A more detailed description of the material risks and uncertainties to which the Group and the parent company are exposed is provided in the Directors’ report and in Notes 30 and 37 in the 2016 Annual Report.

Not

  • te 3

e 3 Al Alte ternat native p e perfor formance m ance meas easur ures es

Due to the nature of Ratos’s operations – acquisition, development and divestment of companies – differences may arise in the structure of the Group between periods. Accordingly, consolidated sales, earnings, cash flow and financial position recognised in accordance with IFRS may vary significantly from period to period as a result of differences in the composition of the company portfolio. Moreover, earnings from company divestments normally arise at irregular intervals, generating significant non-recurrent effects. To facilitate a comparison between periods and enable follow-up of the ongoing earnings and performance of the company portfolio, Ratos presents certain financial information that is not defined in accordance with IFRS. This information is intended to give the reader a better

  • pportunity to evaluate Ratos’s investments and should be regarded as a

complement to the financial information recognised in accordance with IFRS. The following reconciliations and accounts pertain to components included in the alternative performance measures used in this report. Definitions are available at www.ratos.se. As of the January-March 2017 interim report, Net sales, Adjusted EBITA, EBITA and Interest-bearing net debt for the portfolio are no longer reported with the companies included in their entirety. The portfolio is reported adjusted for Ratos’s holdings only. The aim is to clarify for the reader by only using one method of reporting the portfolio.

Net Net sale sales

SEKm 2017 Q1-3 2016 Q1-3 Change 2016 2016 Net sales in the portfolio, Ratos's holding 15,874 15,821 0% 21,570 Net sales in subsidiaries, holding not owned by Ratos 3,107 2,866 3,959 Subsidiaries acquired during current year

  • 3,273
  • 3,627

Subsidiaries divested during current year 1,043 5,665 7,013 Investments recognised according to the equity method

  • 2,377
  • 2,500
  • 3,688

Net sales in accordance with IFRS 17,647 18,579

  • 5%

25,228

slide-24
SLIDE 24

January-September Ratos interim report 2017 24

Adjust usted EBIT ITA, A, EBIT ITA a A and nd oper erat ating ing pro rofi fit Ca Cash h fl flow from o m oper erations In Inter eres est-bearing earing net net deb ebt

SEKm 2016 Q1-3 2016 2016 Adjusted EBITA, Ratos's holding 1,045

  • 7%

1,124 1,337 Items affecting comparability, Ratos's holding

  • 39
  • 186
  • 328

EBITA, Ratos's holding 1,006 7% 938 938 1,009 EBITA in subsidiaries, holding not owned by Ratos 205 142 207 Subsidiaries acquired during current year

  • 407
  • 321

Subsidiaries divested during current year

  • 13

282 330 Exit gain from portfolio companies 663 1,672 Investments recognised according to the equity method

  • 92
  • 128
  • 190

Income and expenses in the parent company and central companies

  • 110
  • 253
  • 326

Amortisation and impairment of intangible assets in connection with company acquisitions

  • 83
  • 2,361
  • 2,617

Consolidated operating profit 1,577

  • 1,786
  • 235

2017 Q1-3 SEKm 2017 Q1-3 Cash flow from operations in portfolio 360 360 Cash flow from operations, holding not owned by Ratos 34 Cash flow from operations, holdings divested during current year 2 Investments recognised according to the equity method

  • 129

Acquisitions and disposals, intangible assets/property, plant and equipment 372 Income tax paid

  • 126

Attributable to the parent company

  • 7

Eliminations

  • 222

Cash flow from operating activities 284 284 SEKm 2017-09-30 Total interest-bearing net debt in the portfolio, Ratos's holding 6,508 Interest-bearing net debt in subsidiaries, holding not owned by Ratos 754 Investments recognised according to the equity method

  • 741

Attributable to the parent company and central companies

  • 2,406

Consolidated interest-bearing net debt 4,115 2017-09-30 2016-09-30 2016-12-31 Non-current interest-bearing liabilities 5,639 7,058 6,953 Current interest-bearing liabilities 1,637 1,717 1,228 Provisions for pensions 494 568 487 Interest-bearing assets

  • 118
  • 316
  • 340

Cash and cash equivalents

  • 3,537
  • 3,752
  • 4,389

Consolidated interest-bearing net debt 4,115 5,275 3,939

slide-25
SLIDE 25

January-September Ratos interim report 2017 25

Not

  • te 4

e 4 Ac Acquir uired ed a and nd d dives este ted b bus usines inesses es

GS GS-Hydro dec ecla lare red ban ankru rupt

In September 2017, Ratos’s subsidiary, GS-Hydro Holding Oy, and its subsidiary, GS-Hydro Oy, filed a bankruptcy petition. The Tavastia Proper District Court issued a bankruptcy order in the same month whereby a trustee assumed control over the portfolio company GS-

  • Hydro. Since Ratos no longer has any influence over GS-Hydro, the

portfolio company will no longer be consolidated in the Ratos Group. From September 2017, the holding has been classified as a financial asset and measured at market value. Since Ratos does not expect to recover anything in the bankruptcy process, the market value on 30 September 2017 was zero. Nor does Ratos have any outstanding commitments to GS-Hydro. Since the carrying amount of GS-Hydro was negative on the date of reclassification from a subsidiary to a financial asset, a positive earnings effect of SEK 68m arises for the Group and is recognised as a Capital gain from Group companies in the consolidated income statement.

Adjust usted acq acquisi uisitio ion n an anal alysis f sis for P r Plan antasj asjen en

Ratos acquired 99% of the shares in Plantasjen in November 2016. In the second quarter of 2017, the preliminary acquisition analysis was adjusted in accordance with the following, which impacted the consolidated statement of financial position for the same period. The adjusted acquisition analysis has not resulted in any material changes to the consolidated income statement.

Div Divest estment ent of f Neb Nebula ula

In May 2017, Ratos signed an agreement to sell all of its shares in Nebula for a selling price (equity value) corresponding to EUR 110m (approximately SEK 1,100m) for 100% of the shares. The sale was completed in July 2017. Ratos’s share of the selling price amounted to EUR 78m (SEK 752m) and the exit gain, which was recognised in the third quarter, amounted to SEK 515m.

Div Divest estment ent of f Ser erena ena Pro roper ertie ies

In June 2017, Ratos signed an agreement to sell all of its shares in Serena Properties for a selling price (equity value) of EUR 90m (approximately SEK 0.9 billion), of which Ratos’s share accounted for EUR 50.4m (SEK 481m). The sale was completed in the third quarter of 2017 and the exit gain of SEK 79m was recognised in the same period.

Div Divest estment ent of f Sophi hion n Bio ioscienc cience

In June 2017, Ratos divested Sophion Bioscience, the final remaining business area of the former portfolio company Biolin Scientific. Ratos divested most of its holding in Biolin Scientific in December 2016 through the sale of the Analytical Instruments business area. The divestment of Sophion Bioscience, which was recognised under other net assets in Ratos, generated only a minor exit gain for Ratos since the holding had previously been impaired to its expected exit value.

Div Divest estment ent of f AH AH Ind Indus ustrie ries

In March 2017, Ratos divested its entire holding of 70% in AH Industries, in accordance with the agreement signed in December 2016. The divestment yielded an exit loss of SEK -32m in the first quarter.

Div Divest estment ent of f the he re remain maining ing ho hold lding ing in in Ar Arcus cus

In December 2016, Ratos’s former subsidiary Arcus was listed on the Oslo Stock Exchange, upon which the company transitioned to being an associate company of Ratos. In March 2017, Ratos also sold its remaining holding of 24% at a price of NOK 762m, corresponding to NOK 47.40 per share. The sale yielded an exit gain of SEK 33m in the first quarter. The total exit gain from the sales of Arcus was SEK 1,437m, of which SEK 1,403m was included in earnings for 2016.

Ac Acquisit uisitions ns wi within hin sub subsid sidia iari ries es

During the second quarter, Nebula completed the acquisition of web hosting supplier Sigmatic Oy before Ratos divested the entire Nebula Group to Telia Company. In the second quarter, Bisnode also completed the acquisition of Global Group Digital Solutions AG, a German leading supplier of solutions based on market information. Plantasjen expanded its offering from 40 garden centres to more than 700 points of sale through the acquisition of SABA Blommor AB. Plantasjen Preliminary acquisition analysis Adjusted acquisition analysis Trademarks 624 715 Customer relations 40 44 Other assets 1,821 1,821 Non controlling interest

  • 11
  • 11

Deferred tax liability

  • 148
  • 172

Other liabilities

  • 3,486
  • 3,486

Net identifiable assets and liabilities

  • 1,159
  • 1,087

Goodwill 2,391 2,319 Consideration transferred 1,232 1,232

slide-26
SLIDE 26

January-September Ratos interim report 2017 26

Not

  • te 5

e 5 Oper erati ating s ng segme egment nts

SEKm 2017 Q3 2016 Q3 2017 Q1-3 2016 Q1-3 2016 2016 2017 Q3 2016 Q3 2017 Q1-3 2016 Q1-3 2016 2016 Aibel

  • 38
  • 13
  • 23
  • 97
  • 198

Bisnode 833 793 2,603 2,493 3,458 70

  • 8

182

  • 79

47 Diab 342 350 1,140 1,126 1,516

  • 23

18

  • 6

61 84 HENT 1,755 1,951 5,333 5,801 7,991 63 48 180 169 191 HL Display 353 368 1,087 1,044 1,417 13 22 26 41 43 Jøtul 234 220 633 592 898 19 9

  • 27
  • 14
  • 10

KVD 82 71 253 236 321 7 5 23 22 31 Ledil 103 100 298 275 365 43 29 80 83 91 Speed Group 126 141 382 426 562 6

  • 1

13 20 11 TFS 219 191 635 553 793

  • 16

12

  • 16

30 6 Total companies in portfolio all reported periods 4,044 4,185 12,363 12,546 17,320 145 145 122 122 432 432 235 235 296 296 airteam 2) 202 189 602 363 601 12 3 20 4 14 Gudrun Sjödén Group 3) 9 1 16 1 8 Oase Outdoors 4) 87 5 394 5 14

  • 12

63

  • 12
  • 44

Plantasjen 5) 886 3,245 280

  • 52

202

  • 37

Total companies acquired during reported periods 1,175 194 194 4,241 368 368 895 895

  • 31
  • 9
  • 9

300 300

  • 8
  • 8
  • 59

AH Industries 310 265 805 1,059 10

  • 2

6 19 Arcus 618 1,771 2,294

  • 21

2 4 Biolin Scientific 53 142 186

  • 2
  • 23
  • 28

Euromaint 310 1,061 1,061 2 9 9 GS-Hydro 126 220 542 666 886

  • 28
  • 35
  • 79
  • 95
  • 149

Mobile Climate Control 333 976 1,194 51 109 77 Nebula 82 177 244 332 21 40 55 71 Serena Properties 5 10 33 41 56 Total companies divested during reported periods 126 126 1,925 985 985 5,665 7,013

  • 23

36 36

  • 7
  • 7

105 105 58 58 Total 5,346 6,305 17,589 18,579 25,228 90 90 149 149 725 725 332 332 295 295 Exit AH Industries

  • 32

Exit Arcus 33 1,403 Exit Euromaint Exit Mobile Climate Control 268 Exit Nebula 515 515 Exit Serena Properties 79 79 Total exit gains 594 594 596 596 1,672 Impairment AH Industries

  • 92
  • 92
  • 135

Impairment Aibel

  • 1,692
  • 1,692
  • 1,692

Impairment Biolin Scientific

  • 314
  • 314
  • 314

Impairment Euromaint

  • 122
  • 122
  • 122

Impairment and result from bankruptcy GS-Hydro 68 68

  • 160

Impairment Jøtul

  • 81
  • 81
  • 81

Companies total 5,346 6,305 17,589 18,579 25,228 752 752

  • 2,152

1,389

  • 1,968
  • 538

Income and expenses in the parent company and central companies Operating management costs

  • 31
  • 50
  • 115
  • 195
  • 261

Other income and expenses, incl. transaction costs

  • 1

58 18

  • 5

4

  • 25
  • 56

Costs which will be charged to portfolio companies 2

  • 14

2

  • 32
  • 9

Financial items 1

  • 7
  • 25
  • 27

Group total 5,344 6,305 17,647 18,579 25,228 741 741

  • 2,227

1,255

  • 2,220
  • 890

1) Subsidiaries are included with 100% in consolidated profit. Investments recognised according to the equity method are included with holding percentage of pre-tax profit/loss. 2) airteam is included as a subsidiary as of April 2016. 3) Gudrun Sjödén Group is included as an associate with a holding of 30% as of September 2016. 4) Oase Outdoors is included as a subsidiary as of September 2016. 5) Plantasjen is included as a subsidiary as of December 2016.

Sales EBT 1)

slide-27
SLIDE 27

January-September Ratos interim report 2017 27

1) Holdings are shown at consolidated figures, which correspond to the Group’s share of the holdings’ equity, any residual values on consolidated

surplus and deficit values minus any intra-group profits. Shareholder loans are also included.

2) Of which cash and cash equivalents in the parent company totalled SEK 2,405m (1,627).

. SEKm 2017-09-30 2016-09-30 2016-12-31 AH Industries 37 Aibel 702 690 587 airteam 367 352 356 Arcus 666 729 Biolin Scientific 31 Bisnode 1,841 1,540 1,606 Diab 717 691 770 Euromaint 68 GS-Hydro 127 Gudrun Sjödén Group 177 161 166 HENT 386 298 298 HL Display 926 829 840 Jøtul

  • 23

4 KVD 373 347 356 Ledil 399 531 530 Mobile Climate Control 1,116 Nebula 276 283 Oase Outdoors 163 155 137 Plantasjen 1,390 1,303 Serena Properties 396 398 Speed Group 298 301 296 TFS 235 192 168 Total 7,950 8,805 8,825 Other net assets in the parent company and central companies 2) 2,275 1,475 2,458 Equity (attributable to owners of the parent) 10,225 10,279 11,283 Consolidated value 1)

slide-28
SLIDE 28

January-September Ratos interim report 2017 28

Not

  • te 6

e 6 Fi Financial i nancial ins nstrum ument nts

Ratos applies fair value measurements to a limited extent and mainly for derivatives and synthetic options, contingent considerations and put

  • ptions. These items are measured according to levels two and three,

respectively, in the fair value hierarchy. The measurement methods were unchanged during the period. In the statement of financial position at 30 September 2017, the total value of financial instruments measured at fair value in accordance with level three was SEK 359m (510 at 31 December 2016). This change was primarily attributable to the payment of additional purchase considerations. In the statement of financial position at 30 September 2017, the net value of derivatives amounted to SEK -27m (-18), of which SEK 7m (24) was recognised as an asset and SEK 34m (42) as a liability.

Not

  • te 7

e 7 Goo

  • odwil

will

Goodwill changed during the period as shown below.

Not

  • te 8

e 8 Rela Relate ted part arty y dis isclos closur ures es

Transactions with related parties are made on market terms.

Parent arent compan any

The parent company has a related party relationship with its Group

  • companies. For more information, refer to Note 33 in the 2016 Annual
  • Report. The parent company has no pledged assets. The parent company

has contingent liabilities to subsidiaries and associates amounting to SEK 321m (492). In addition, the parent company guarantees that Medcro Intressenter AB will fulfill its obligations in connection with the acquisition of TFS. The parent company’s transactions with subsidiaries and associates for the period and the parent company’s balance sheet items in relation to its subsidiaries and associates at the end of the period are presented below. During the quarter, Ratos provided a contribution of SEK 19m to GS-

  • Hydro. Earlier during the year, Ratos provided a contribution of SEK 54m

to Bisnode (add-on acquisition), SEK 55m to HL Display, SEK 32m to AH Industries and SEK 26m to Sophion. SEKm Accumulated cost Accumulated impairment Total Opening balance 1 January 2017 14,522

  • 1,532

12,990 Business combinations 114 114 Divested companies

  • 493

469

  • 24

Reclassified to Assets held for sale

  • 846
  • 846

Reclassifications

  • 70
  • 70

Translation differences for the year

  • 118

14

  • 104

Closing balance 30 September 2017 13,111

  • 1,050

12,061 SEKm Capital contribution Dividend 2017 Q1-3 185 572 2016 Q1-3 746 2016 814 SEKm Receivable Provision Liability Contingent liability 2017-09-30 50 114 3,142 321 2016-09-30 4 144 879 492 2016-12-31 1 90 2,269 533

slide-29
SLIDE 29

January-September Ratos interim report 2017 29

Tel elep epho hone ne con

  • nferen

ference

14 November at 10.00 a.m. +46 8 506 39 549 +44 20 3008 9804 +1 855 753 2235

Fi Fina nanc ncial calend endar

2018 Year-end report 2017 16 February 2018 Interim report January-March 3 May 2018 Interim report January-June 17 August 2018 Interim report January-September 25 October 2018 Stockholm, 13 November 2017 Ratos AB (publ) Magnus Agervald CEO For further information, please contact: Magnus Agervald, CEO, +46 8 700 17 00 Helene Gustafsson, Head of IR and Press, +46 8 700 17 98 This report has not been reviewed by Ratos’s auditors. This information is information that Ratos AB (publ) is obliged to make public pursuant to the EU Market Abuse Regulation and the Swedish Securities Market Act. The information was submitted for publication, through the agency of the contact person set out above, on 14 November 2017 at 8:00 a.m. CET. Ratos AB (publ) Drottninggatan 2 Box 1661 SE-111 96 Stockholm Tel +46 8 700 17 00 www.ratos.se Reg. no. 556008-3585

Ratos owns and develops unlisted medium-sized companies in the Nordic countries. Our goal as an active owner is to contribute to long-term and sustainable business development in the companies we invest in and to make value-generating transactions. Ratos’s portfolio consists of 14 medium- sized Nordic companies and the largest segments in terms of sales are Industrials, Consumer goods/Commerce and Construction. Ratos is listed on Nasdaq Stockholm and has approximately 13,400 employees.