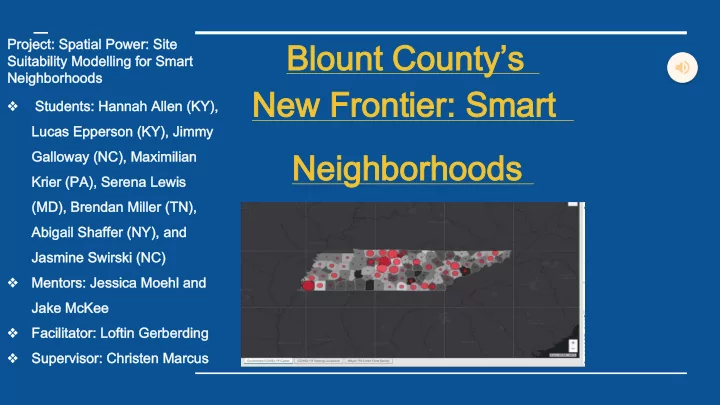

Project: Spatial Power: Site Project: Spatial Power: Site Blount County’s Blount County’s Suitability Modelling for Smart Suitability Modelling for Smart Neighborhoods Neighborhoods New Frontier: Smart New Frontier: Smart ❖ Students: Hannah Allen (KY), Students: Hannah Allen (KY), Lucas Epperson (KY), Jimmy Lucas Epperson (KY), Jimmy Galloway (NC), Maximilian Galloway (NC), Maximilian Neighborhoods Neighborhoods Krier (PA), Serena Lewis Krier (PA), Serena Lewis (MD), Brendan Miller (TN), (MD), Brendan Miller (TN), Abigail Shaffer (NY), and Abigail Shaffer (NY), and Jasmine Swirski (NC) Jasmine Swirski (NC) ❖ Mentors: Jessica Moehl and Mentors: Jessica Moehl and Jake McKee Jake McKee ❖ Facilitator: Loftin Gerberding Facilitator: Loftin Gerberding ❖ Supervisor: Christen Marcus Supervisor: Christen Marcus
Introduction Introduction ❖ Are Smart Neighborhoods the future? If so, we need to find the best possible location Are Smart Neighborhoods the future? If so, we need to find the best possible location to build them; and that is exactly what our research team has been working on for to build them; and that is exactly what our research team has been working on for the past two weeks. So let's find out where to build the future together! the past two weeks. So let's find out where to build the future together!
About the Project About the Project ❖ What is a smart neighborhood? A smart neighborhood is an efficient community that uses technology to What is a smart neighborhood? A smart neighborhood is an efficient community that uses technology to reduce electricity waste and energy costs. It uses electronics to collect data to efficiently improve reduce electricity waste and energy costs. It uses electronics to collect data to efficiently improve operations. They take advantage of energy and natural innovations. operations. They take advantage of energy and natural innovations. ❖ Why are we doing this? We are doing this project to help create a Why are we doing this? We are doing this project to help create a positive future as well as a role model of what smart positive future as well as a role model of what smart neighborhoods are capable of. It can improve Blount County and neighborhoods are capable of. It can improve Blount County and the overall environment the overall environment ❖ Why did we choose Blount County? The client was wanting to build a Why did we choose Blount County? The client was wanting to build a smart neighborhood in Blount County to be more electrically efficient. smart neighborhood in Blount County to be more electrically efficient. ❖ Why did we choose this exact area in Blount County? We used QGIS, a Why did we choose this exact area in Blount County? We used QGIS, a computer software, to look at plenty of factors first responders, schools computer software, to look at plenty of factors first responders, schools locations, distance to roads, noise pollution, etc. to find an ideal location locations, distance to roads, noise pollution, etc. to find an ideal location to meet the criteria of a smart neighborhood. to meet the criteria of a smart neighborhood.
About The Software About The Software To determine the location of our smart ● neighborhood we used software called Quantum Geographical Information Science, (QGIS). QGIS is a software used to compile and view ● geographical data. We learned to compile the data we gathered from ● online resources into QGIS to create in depth and complex maps of Blount County, Tennessee. With these maps, we could take the data and ● create proximity maps and scale center areas of the map based on crime rates and school districts.
About the data About the data Each group participant was assigned data to research location criteria ● This data was inputted into QGIS and rasterized into color values which revealed extreme ● data points which revealed which was the best and the worst area. Some of the different types of data we considered were crime, amenities, roads, city limits, ● and flooding areas From the data we learned the optimal area for the smart neighborhood ● *Crime rates rasterized *Traffic Density rasterized
Optimal Area Optimal Area The information that incorporated concludes that the corner of Central Point Road and Martin Mill Pike in Rockford, Tennesseeis the best area, since it conforms with the following criteria which is: ● Crime Rates ● Traffic flow ● Distance to amenities ● City limits Following these boundaries will result in finding the highest quality area for a new neighborhood.
Conclusion Conclusion Thank you for your time! We learned so much about spatial analysis and the scientific process. We appreciate all the help and guidance from the mentors and researchers.
Recommend
More recommend