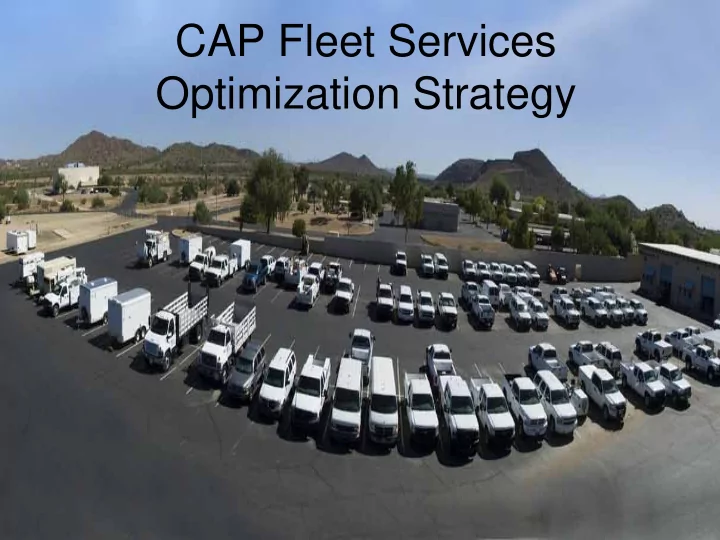

CAP Fleet Services Optimization Strategy
Fleet Services Division n Transferred to Centralized Maintenance July 2010 as part of Maintenance Group realignment n At the direction of the General Manager, a review of the fleet configuration was initiated n Review identified 6 areas for optimizing 2
Light Fleet Statistics/Concerns 3,336,639 miles driven in 2010 n 178 total light fleet vehicles n 68 Two Wheel drive vehicles n 110 Four Wheel Drive vehicles n Out of the total there are: n 37 SUVs n 54 crew cabs n 6 automobiles n Fleet configuration n No standard vehicle defined for O & M n Lack of standardization impacts parts, procedures and supply n chain Utilization rates can be improved n
Components of Optimization strategy n Fleet standard vehicle n Policy for vehicle assignment - Pending n Management of vehicle pools - Ongoing n Online Reservation Tool n Economical addition of hybrids n Identify the “Right sized” Fleet 4
Light Fleet Standard Vehicles n Maintenance Fleet n Two Wheel Drive Extended Cab ½ ton Standard Size Pickup Truck Acquisition Cost $24,000 n $0.05 per mile lower operating costs n Administration Pool n 4-Door Sedans n Hybrid Vehicles n Multi-Passenger Vehicles Available in Both Pools 5
Vehicle Assignment Policy n Set of guidelines to standardize how vehicles are assigned to employees n Guidelines to be developed in partnership with departments n Target date for draft is the end of Q2 2011 6
Online Reservation System n Online system will offer opportunities to improve vehicle utilization n Evaluation of existing functionality in INFOR n Assigned to IT Project Management 7
Hybrids n This type of vehicle is most suitable for our Administration Pool n Economics of Hybrid Vehicles n Extra acquisition cost n Improved mileage n Lower operating costs n Reduced emissions 8
Projected Savings by replacing 4x4's Pickups with 2x4 Pickups 7 year 2011 2012* 2013* 2014* 2015* 2016* 2017* savings #4x4's replaced 6 14 14 14 14 10 10 82 Initial Purchase cost savings $15,000 $35,000 $35,000 $35,000 $35,000 $25,000 $25,000 $205,000 Operating savings average $1,000 per vehicle * Cost data is based on 2010 dollars and 2010 fuel cost (less than $3.00/gal.) $6,000 $20,000 $34,000 $48,000 $62,000 $72,000 $82,000 $324,000 Cumulative Savings $21,000 $55,000 $69,000 $83,000 $97,000 $97,000 $107,000 $529,000 * Estimated replacements of 4 x 4s Present Light Fleet 4x4's - 104 Remaining Total eliminated 4x4's 4x4's 82 21 9
Sport Utility Vehicles n 37 in fleet n $10,000 plus higher cost for the 4x4 SUVs than the defined fleet standard truck n Most SUVs will be cycled out when they reach the end of their life cycles and replaced with standard trucks. 10
2011 Vehicle Replacement Schedule Org Replace Unit # Year & Make of Repl Object Current Miles Budget COST 2000 Chevy Pickup 510 G-062CK 4X2 9758 127800 $25,430 $24,000 1/2 4x2 pick up 510 G-519DX 2004 Ford x-cab 4x4 38765 131500 $28,016 $24,000 1/2 4x2 pick up 2003 Dodge Durango 544 G-549DM 4x4 36156 142000 $35,860 $24,000 1/2 4x2 pick up 2002 Dodge Durango 550 G-180DH 4x4 34050 117000 $34,480 $24,000 1/2 4x2 pick up 2001 Dodge x-cab 551 G-090CK 4x4 9824 133800 $34,480 $24,000 1/2 4x2 pick up 1997 Ford Explorer 551 G-846BN 4x4 8352 122400 $34,480 $24,000 1/2 4x2 pick up 621 G-242BV 1998 Chevy C/C 4x2 8645 83600 $37,080 $24,000 1/2 4x2 pick up 631 G-245BV 1998 Chevy C/C 4x2 8644 90400 $30,660 $24,000 1/2 4x2 pick up 1998 Ford Expedition 555 G-208BV 4x2 8518 134500 $29,085 $24,000 1/2 4x2 pick up 1998 Chevy x-cab 3/4 ton 4x2 x-cab utility 839 G-680BW 4x4 8641 90000 $30,766 $31,500 bed $320,337 $247,500 Reduce 4x4 by 6 in 2011 Reduce SUV by 4 in Acquisition 2011 Savings $72,837 11
Fleet Sizing/Purchases n Tools to manage fleet size n Online reservation system to assist in managing for better utilization n Utilization review reporting and management of assets – reduces idle time of vehicles n Cooperative efforts to provide economical service to fleet customers and CAP n Two vehicle replacements have been deferred based on their condition rather than a mileage limit n Fleet has been reduced by 11 vehicles 2010/11 12
In Conclusion: n Standard fleet truck defined with internal customer input n Online pool reservation system to be implemented n $72,800 in 2011 acquisition savings, purchasing the CAP standard truck n Increasing fuel costs are inevitable, optimizing the fleet will lessen the impact n Moving from automatic replacements based on miles to “condition based” replacements 13
Recommend
More recommend