Californiarangelandstatus,structureandfunc2on ValerieEviner,UCDavis - - PowerPoint PPT Presentation

california rangeland status structure and func2on valerie
SMART_READER_LITE
LIVE PREVIEW

Californiarangelandstatus,structureandfunc2on ValerieEviner,UCDavis - - PowerPoint PPT Presentation

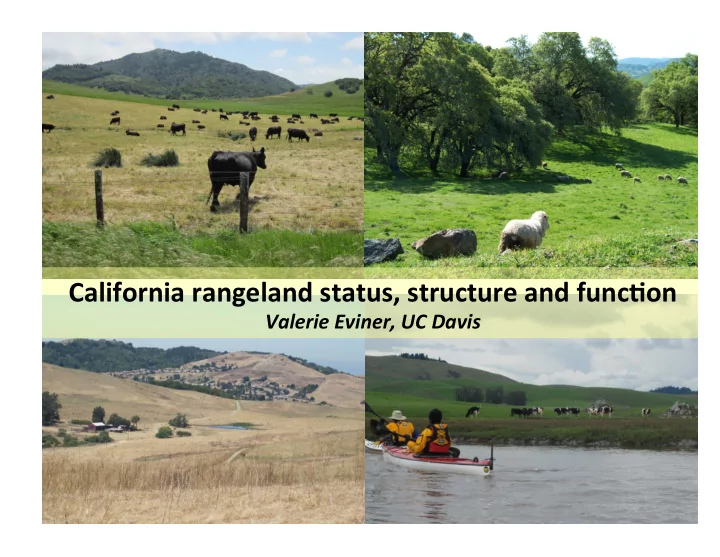
Californiarangelandstatus,structureandfunc2on ValerieEviner,UCDavis Million acres Rangeland 57 Area Availablefor 41 Grazing AreaGrazed 34 FRAP2003 Grasslands


slide-1
SLIDE 1

California
rangeland
status,
structure
and
func2on


Valerie
Eviner,
UC
Davis


slide-2
SLIDE 2

FRAP
2003


Million
 acres
 Rangeland
 Area
 57
 Available
for
 Grazing
 41
 Area
Grazed
 34


slide-3
SLIDE 3

Grasslands
 (including
within
 hardwood
 woodlands)
 provide
over
2/3


  • f
CA
livestock


forage


FRAP
2003


slide-4
SLIDE 4
slide-5
SLIDE 5

States


 Exo2c
annual
 grassland
 (grasses
and
forbs)


 Na2ve
grassland
 (grasses
and
forbs)
 
 
 “New”
exo2cs
 ‐ Medusahead


‐ Goatgrass


‐ Yellow
starthistle
 
 Oak
woodland


Oak
savanna
 
 
 Shrubs


slide-6
SLIDE 6

Major
driver
of
 func?on/
 composi?on


  • Timing
of


precipita?on
and
 warm
 temperatures


  • Variability
in


precipita?on


  • Past
20
years,
6‐8


fold
annual
 varia?on
in
 precipita?on


  • At
least
8
mul?‐

year
droughts
 since
1900


Summer Fall Winter Early Spring Late Spring

a

Precipitation Temperature

Summer

Climate

Wet-up

Summer Fall Winter Early Spring Late Spring Summer

Aboveground Belowground

Plant growth rate b

Wet-up

Biswell
1956,
Eviner
&
Firestone
2007


slide-7
SLIDE 7

Factors
influencing
produc?on
and
 states
and
transi?ons


  • Precipita2on‐

amount,
seasonality

  • Soil‐
nutrients
(N,P,
S),
water

  • Grazing‐
?ming,
intensity,
frequency,
type,
dura?on


– Also
herbivory
by:
grasshoppers,
elk,
deer


  • Fire‐
?ming,
intensity,
frequency,
type

  • Soil
disturbance
by
animals
(gophers,
ground
squirrels,


feral
pigs,
earthworms)
e.g.
pocket
gophers
turn
over
 en?re
soil
surface
every
3‐15
years


  • Granivory‐
voles,
mice,
ants

  • Pathogens‐
barley
yellow
dwarf
virus,
sudden
oak
death

  • Compe??on
between
plant
groups


slide-8
SLIDE 8

Plant
community
 Nitrogen
 availability
 Other
 Key
determinants


  • f
impacts


Fire
 Spring
burning
o[en
 increases
forbs
in
 short‐term
 Short‐term
 increase
in
 nitrogen
 availability
 Short‐term
 erosion
 Timing
 Frequency
 
 Soil
 disturbance
by
 mammals
 O[en
increases
forbs
 in
short‐term
 
poten?al
to
increase
 annual
exo?cs
 Short‐term
 increase
in
 nitrogen
 availability,
soil
 carbon
release
 
 Short‐term
 erosion
 Timing
 Frequency
 Grazing
 Generally
increase
 na?ve
annual
forbs
 Varied
impacts
on:
 exo?c
grasses,

na?ve
 grasses,
produc?vity
 No
impact
to
 slight
increase
in
N
 pools,
cycling
 Redistribu?on
 Compac?on
 Alter
small
 mammal
ac?vity
 Trampling
of
 thatch
 Increase
root
 alloca?on
 Timing
 Frequency
 Dura?on
 Intensity
 Grazer
Type
 Weather
 Vegeta?on
type
 Grazing
 exclusion
 Increased
thatch
can:
 ‐
Decrease
produc?on
 ‐ Decrease
forbs
(2‐ fold)
 ‐ 
Increase
fire
 ‐ Increase
goatgrass


slide-9
SLIDE 9

States
alter
 func?on


 Exo2c
annual
 grassland
 (grasses
and
forbs)


 Na2ve
grassland
 (grasses
and
forbs)
 
 
 “New”
exo2cs
 ‐ Medusahead


‐ Goatgrass


‐ Yellow
starthistle
 
 Oak
woodland


Oak
savanna
 
 
 Shrubs


slide-10
SLIDE 10

Annual
state
is
“weird”


  • Mediterranean
climate‐
cool
season
grasses
dominate

  • Invaders
are
early
successional
in
their
na?ve
range,


stable
state
in
CA
(this
is
gedng
increasingly
common
 throughout
W.
US
rangelands)


  • Standard
rangeland
assessments
don’t
work
in
CA‐


annual
is
considered
“degraded”
state


Westoby
et
al.
1989


slide-11
SLIDE 11

Need
different
frameworks
 to
assess
annual
func?on


 Exo2c
annual
 grassland
 (grasses
and
forbs)


 Na2ve
grassland
 (grasses
and
forbs)
 
 
 “New”
exo2cs
 ‐ Medusahead


‐ Goatgrass


‐ Yellow
starthistle
 
 Oak
woodland


Oak
savanna
 
 
 Shrubs


slide-12
SLIDE 12

Future
challenges


  • Invasive
species

  • Temperature
Change


– increased
temperature,
2‐4
fold
increases
in
frequency
of
heat
stress
days


  • Precipita?on
Change


– Mean
annual
precipita?on
predic?ons


  • Northern
California‐
0‐18%
decrease
(Greatest
decrease
in
the
Central
Valley


and
North
Coast)


  • Southern
California‐
26%
decrease
to
8%
increase


– Seasonality


  • Shorter
growing
seasons
(most
decreases
in
late
spring/summer)

  • Moderate
winter
decreases‐
but
less
frequent,
more
intense
storms

  • Spring/fall
precipita?on
not
well‐modeled
(but
likely
most
important
for
vegeta?on


composi?on)
 – Annual
variability
will
increase


  • 1.5‐2.5
fold
increase
in
frequency
of
cri?cally
dry
years

  • Increased
El
Nino
frequency

  • Nitrogen
deposi?on‐
increase
invasion

  • Land
use
change


– Projected
to
lose
750,000
acres
of
rangeland
by
2040‐2100)


  • Increased
expecta?ons
of
what
rangelands
should
deliver