
SLIDE 1
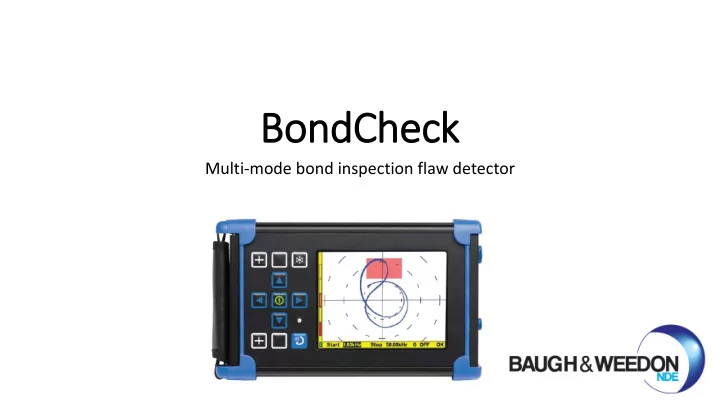
BondCh Check ck
Multi-mode bond inspection flaw detector
BondCh Check ck Multi-mode bond inspection flaw detector BondC - - PowerPoint PPT Presentation
BondCh Check ck Multi-mode bond inspection flaw detector BondC dChe heck Introduc duction Multi-mode bond testing instrument Pitch-catch Resonance MIA ( Mechanical Impedance ) Built on established AeroCheck+ EC instrument
Multi-mode bond inspection flaw detector
Multi-mode bond testing instrument
Built on established AeroCheck+ EC instrument architecture Additional dedicated hardware to support signals from bond testing probes
Standard model Domed and Flat probe tips Rubber hand grip CNC machined body Configurable guide feet Alarm LED Small footprint model Same core design Improved inspection access
6 standard inspection frequencies 75, 90, 165, 200, 250, 330kHz Ergonomic polymer casing Stainless steel probe housing Hard wearing Alumina front face Alarm LED in top cover Probe memory holds serial number, default and preferred settings, and air calibration data.
General purpose probe Operation 2kHz to 10kHz Ergonomic polymer casing Brass probe tip Spring loaded coupling mechanism Integrated electronics to optimise signal Alarm LED in top cover Probe memory holds serial number, default and preferred settings.
Honeycomb sandwich materials FRP/Aluminium/Titanium skins Aluminium/Nomex core Metallic bonded lap joints Stringers/stiffeners CFRP components Delaminations, stringer bonding
FRP Honeycomb Al/Ti Honeycomb Bonded aluminium CFRP Near surface Far surface Near surface Far surface Pitch-Catch Resonance MIA
Methods tend to be application specific Material construction varies considerably in skin thickness/stiffness, core thickness/density, skin surface roughness. Can have a very significant influence on which method works well
Wide area scanning Defect size resolution Ease of coupling Pitch-Catch Lower resolution than MIA Tip spacing 17mm Dry coupling dual contact Resonance Difficult to couple Resonant frequency determines piezo diameter Liquid coupling required MIA Point measurement, easy coupling, Smallest probe contact Dry coupling
Suitability for scanning applications (automated or wide area manual) Considerations are coupling, contact area, minimum defect sensitivity
RF “A-Scan” Flying dot X-Y Plane Frequency Spectrum Amplitude Phase Fixed Freq Freq Sweep Amplitude Phase Pitch-Catch Resonance MIA
Pitch-catch mainly amplitude based method Resonance is combined phase and amplitude method MIA is phased based method only Frequency spectrum analysis generally less established
Pair of probe tips to transmit and receive. Surface wave transmitted from tx to rx Well bonded structure absorbs acoustic energy, reducing energy in surface wave received Dis-bonds in structure absorb less energy, surface wave with higher amplitude received
Bond / Dis-bond damping occurs at different frequencies and time base posit-on depending on geometry and defect location TX Element RX Element
Disbond changes effective thickness
Transducer operated at Air resonant frequency Resonance modified by coupling to material Disbond introduces air gap under top substrate Reduces effective material thickness Adhesive also adds damping to structure Modifies amplitude and phase response of probe
Common misconception, the inspection frequency is not the resonant frequency of the bonded layer !
Spring Model Equivalent Circuit Operate near to mechanical resonant frequency of material surface (honeycomb skin ). Surface stiffness of material determines mechanical damping of receive element. Phase of mechanical vibrations at receive element sensitive to damping/stiffness. Disbonded area low stiffness Bonded area high stiffness
Bond-Disbond calibration for resonance mode probes
Narrow band sweep around resonant frequency
Frequency shift due to dis-bond clearly visible in Amplitude and Phase responses
Amplitude calibration Phase calibration
Allows reference waveform to be subtracted from response. Works best in pitch-catch mode Easier to spot defect areas and setup gates Press when the RF signal is live. Remember to press again in order to return to normal waveform view !
RF Waveform NULL Unique Feature
Automatically positions waveform Gate to highest amplitude position, thresholds to 80% of signal height. Saves time setting up inspections Press select key on
Auto Gate Position
Gate in wrong place Gate in right place
Easy to use calibration functions – reduce wasted time, improve POD
Quick frequency scan on bonded and dis-bonded Sections. Software identifies best frequency for inspection Amplitude and phase responses displayed
Accept automatic frequency or adjust manually
Calibration auto-gain feature explained
For wide frequency calibration sweeps difficult to know what gain setting to use. Too much gain causes saturation, calibration not valid Too little gain and poor readings taken Select and gain is continuously
to keep measurement in range. As gain is applied, the amplitude data is corrected.
Air calibration for resonance mode probes
Optimum resonant frequency varies slightly from
Operating at exact resonant frequency vastly increases measurement sensitivity Hold probe in air and BondCheck identifies the most sensitive inspection frequency. Store air calibration in the probe memory
Press on side bar menu in MIA mode Enables bar chart showing Amplitude and Phase Phase trigger thresholds shown as defined in Gate menu. Press balance key to centre bar graph and set phase thresholds
Phase Bar Chart for MIA Mode
Bonded Region, phase bar chart at zero Un-bonded Region, bar chart shows large phase shift
instrument from ETher NDE
Eddy Current Flaw Detector combined with excellent Pitch-Catch functionality.
rapid detection of defects in laminate, bonded and sandwich structures.