blue carbon in coastal wetlands considera on of lateral
play

- PDF document

Blue&Carbon&in&Coastal&Wetlands:&Considera>on&of& Lateral&and&Ver>cal&Carbon&and&Greenhouse&Gas& Fluxes& Kevin&D.&Kroeger 1 ,&Neil&Ganju 1


  1. Blue&Carbon&in&Coastal&Wetlands:&Considera>on&of& Lateral&and&Ver>cal&Carbon&and&Greenhouse&Gas& Fluxes& Kevin&D.&Kroeger 1 ,&Neil&Ganju 1 ,&John&W.&Pohlman 1 ,&Serena& Moseman<Val>erra 2 ,&Jianwu&Tang 3 ,&Christopher&Weidman 4 ,& Adrian&Green 1 ,&Sandra&Baldwin 1 ,&T.W.&Brooks 1 ,&Michael& Casso 1& 1 USGS,&Woods&Hole&Coastal&&&Marine&Science&Ctr,&MA,&USA& 2 University&of&Rhode&Island,&Kingston,&RI,&USA& 3 The&Ecosystems&Center,&Woods&Hole,&MA,&USA& 4 Waquoit&Bay&Na>onal&Estuarine&Research&Reserve,& Falmouth,&MA,&USA& & 
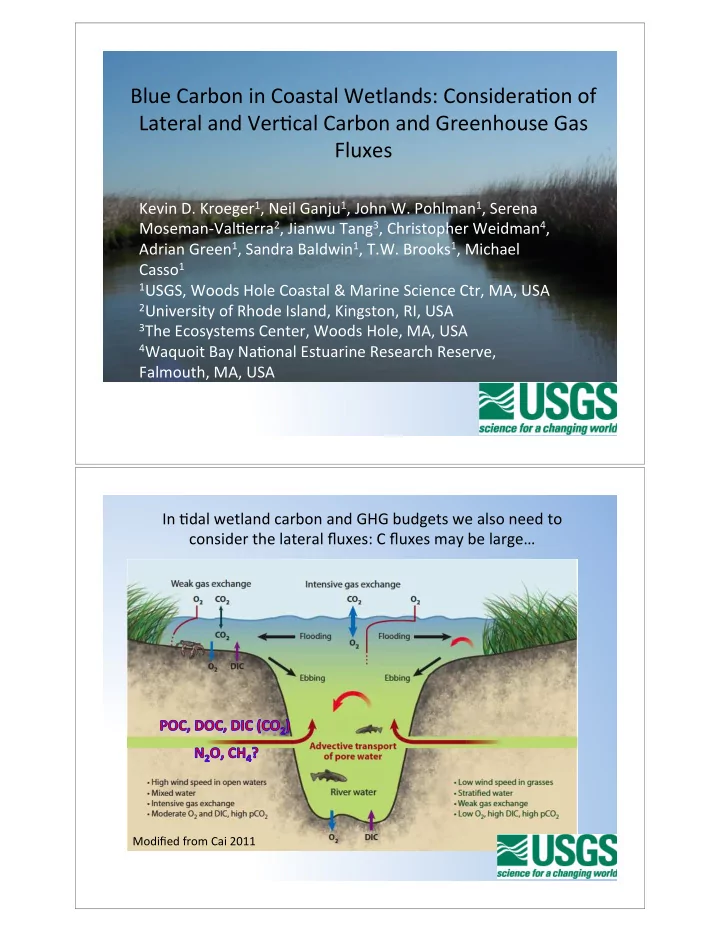
In&>dal&wetland&carbon&and&GHG&budgets&we&also&need&to& consider&the&lateral&fluxes:&C&fluxes&may&be&large…& Modified&from&Cai&2011&

  2. Maria%Tzortziou,%Patrick%J%Neale,%J%Patrick%Megonigal%% (A) (B) (C) (D) (E) (F) (G) (H) Net&ecosystem&C&balance&(NECB)&& &NECB&=&NEP&–&RCH 4 &–&FL.& &NEP:&net&ecosystem&produc>on,&closed&transparent&chamber& & &RCH 4 :&CH 4 &flux&measured&simultaneously&with&NEP;&FL:&net&lateral&flux&& Megonigal&&&Neubauer&

  3. Sage%Lot%Pond:%Lowest%N%site% The&most&intensive&work&has& been&at&the&Sage&Lot&Pond& site.& & WBNERR&staff&installed&a& boardwalk,&bridges&and&other& infrastructure.& & The&site&is&their&Salt&Marsh& Observatory,&and&there&is& con>nuous&monitoring&of& many&parameters.& & Lateral&flux&measurements& are&made&at&the&mouth&of& this&creek.& Photo&provided&by&Jim&Rassman& (WBNERR)& Conceptual&approach&to&lateral&flux&measurements& Water&flux&(u&x&A),&m 3 /s:& <High<frequency& measurements&to&reduce&error& <Maximum&channel&coverage& <Consistent&procedure& & & Concentra>on&(c),&g/m 3:& <Sufficient&ver>cal/lateral& sampling&& <Look&for&proxy&parameters& that&we&can&measure& con>nuously& & & & Total&flux&(u&x&A&x&c),&g/s& & Analytes:&CO 2 ,&DIC,&DOC,&CH 4 ,& POC,&N 2 O,&N,&P&

  4. Is&FDOM&a&good&proxy&for&DOC?& 3.5 • FDOM&and&DOC&have&strong& posi>ve&correla>on& 3.0 • FDOM/DOC&vary&seasonally& DOC (ppm) 2.5 2.0 R ² = 0.92197 1.5 P&<&0.05& 1.0 0 0.1 0.2 0.3 0.4 0.5 FDOM (Voltage) June& April& July&

  5. July% 0.5& 16 15.8 0.4& Pressure%(psia)%% FDOM%(Voltage)% 15.6 0.3& 15.4 0.2& 15.2 0.1& 15 14.8 0& 18th 19th 20th 21st 22nd 23rd 16:51:01 16:51:01 16:51:01 17:25:01 17:25:01 17:25:01 Date and Time Pressure& FDOM& Salinity& April&9,&2012—Full&>dal&cycle&with&gas&measurements& 40
 30
 Salinity
 Methane
 35
 30
 29
 Methane
(ppm)
 25
 Salinity
 20
 28
 15
 10
 27
 5
 0
 26
 1800
 8.1
 Carbon
dioxide
 1600
 8
 pH
 1400
 Carbon
dioxide
(ppm)
 7.9
 1200
 7.8
 1000
 pH
 7.7
 800
 7.6
 600
 7.5
 400
 7.4
 200
 0
 7.3
 12:00
 14:24
 16:48
 19:12
 21:36
 0:00
 2:24
 Flood& Ebb&

  6. 1800
 1600
 Carbon
dioxide
(ppm)
 1400
 1200
 1000
 800
 600
 400
 200
 0
 7.3
 7.4
 7.5
 7.6
 7.7
 7.8
 7.9
 8
 8.1
 pH
 1200
 1000
 CDOM
(counts)
 800
 600
 400
 200
 0
 0
 200
 400
 600
 800
 1000
 1200
 1400
 1600
 1800
 CO2
(ppm)
 40
 35
 Methane
(ppm)
 30
 25
 20
 15
 10
 5
 0
 0
 200
 400
 600
 800
 1000
 1200
 1400
 1600
 1800
 CO2
(ppm)
 40
 35
 Methane
(ppm)
 30
 25
 20
 15
 10
 5
 0
 26
 26.5
 27
 27.5
 28
 28.5
 29
 29.5
 Salinity


  7. Water&flux&(m 3 /s)& Methane&(nM)& Methane&flux&(µmol/s)& Flood& Ebb& 40
 30
 Salinity
 Methane
 35
 30
 29
 Methane
(ppm)
 25
 Salinity
 20
 28
 15
 10
 27
 5
 0
 26
 1800
 8.1
 Carbon
dioxide
 1600
 8
 pH
 1400
 Carbon
dioxide
(ppm)
 7.9
 1200
 7.8
 1000
 pH
 7.7
 800
 7.6
 600
 7.5
 400
 7.4
 200
 0
 7.3
 12:00
 14:24
 16:48
 19:12
 21:36
 0:00
 2:24
 Flood& Ebb&

  8. Interpreta>ons&and&Comments&on& Methods& Measurements&and&understanding&of&lateral&fluxes&are&cri>cal&to& • calcula>ons&of&carbon&budgets,&and&to&interpreta>ons&of&C&sequestra>on& and&GHG&flux&rates.& • Saline&wetland&porewater&may&be&the&major&source&for&CO 2 ,&DIC&and&DOC,& with&flux&rates&influenced&by&>dal&amplitude.& • Reduced&salinity&(groundwater<influenced)&porewater&is&likely&the&major& source&for&high&CH 4 &concentra>ons&at&low&>de.&& • High&sensi>vity&of&flux&calcula>ons&to&small&differences&in&concentra>on&at& >mes&of&major&water&flux&is&a&cri>cal&feature&and&limita>on:&Insufficient& frequency&of&measurements&or&insufficient&accuracy&could&contribute&to& the&lack&of&consensus&in&the&literature&about&the&role&of&coastal&wetlands& as&exporters&or&importers&of&carbon.& Con>nuous&data&appears&to&be&necessary,&given&the&high&degree&of& • variability&on&daily&>mescales&and&sensi>vity&of&calcula>ons&to&small& differences&in&concentra>on&between&flood&and&ebb&>de,&and&to&temporal& varia>ons&in&the&water&budget.&

Download Presentation
Download Policy: The content available on the website is offered to you 'AS IS' for your personal information and use only. It cannot be commercialized, licensed, or distributed on other websites without prior consent from the author. To download a presentation, simply click this link. If you encounter any difficulties during the download process, it's possible that the publisher has removed the file from their server.

Recommend


More recommend