
SLIDE 1
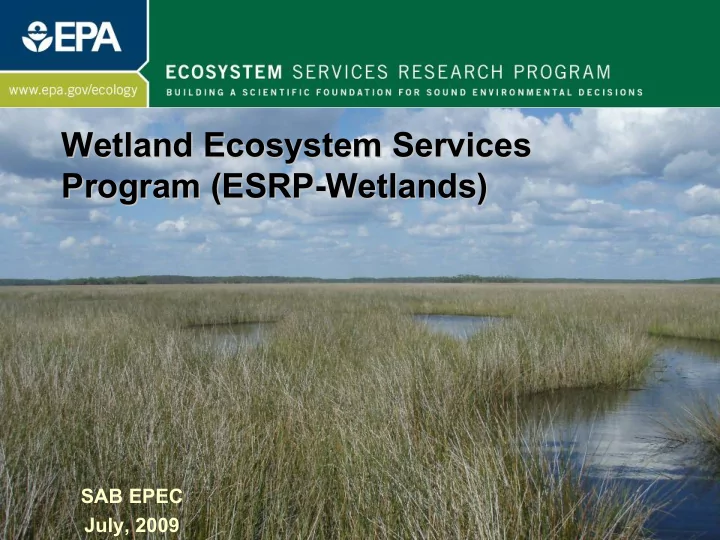
Wetland Ecosystem Services Wetland Ecosystem Services Program (ESRP Program (ESRP-
- Wetlands)
Wetlands)
SAB EPEC July, 2009
Wetland Ecosystem Services Wetland Ecosystem Services Program - - PowerPoint PPT Presentation
Wetland Ecosystem Services Wetland Ecosystem Services Program (ESRP- -Wetlands) Wetlands) Program (ESRP SAB EPEC July, 2009 Why Wetland Eco Services? Why Now? Why ESRP? Located between land and water, wetlands are buffers for human
SAB EPEC July, 2009
2
human impacts on receiving waters
Act
(2008) – avoid, minimize, and compensate – recognizes the ecosystem benefits of wetlands
throughout the US, by public and private agencies and
3
Dahl, T.E. 2006. Status and trends of wetlands in the conterminous United States 1998 to 2004.
Intertidal Vegetated Lost 32,400 acres Intertidal non-vegetated Gain 5,900 acres Freshwater Emergent Lost 142,600 acres Freshwater Forest Gain 548,200 acres Freshwater Shrub Lost 900,800 acres Ponds / nonvegetated Gain 715,300 acres Both Estuarine and Freshwater Wetland Losses were to Open Water types (open salt water and ponds) “No Net Loss” policies obscure potential losses in services (e.g. as open water ponds replace vegetated wetlands
4
5
ESRP Organizational Matrix
Projects and Long term Goals → LTG 3 Pollutant- Specific Studies: 6% LTG 4 Ecosystem Specific Studies: 23% LTG 5: Community Based Demonstration Projects: For National, Regional, State and Local Decisions 28%
Theme Leads
Cross Program Themes and Research Objectives Nitrogen (6%) Wetlands (22%) Coral Reefs (5%) Willamette (11%) Tampa Bay (4%) Mid-West (4%) Coastal Carolinas (8%) Southwest (1%) Ecosystem Services and Human Well- Being (3%) Laura Jackson Valuation of Ecosystem Services Wayne Munns-- Consultation Committee Decision Support (6%) Ann Vega Integration, Well- Being, Valuation, Decision Support, Outreach and Education LTG 1 9% Outreach & Education to Open Landscape Characterization and Mapping (12%) Anne Neale Inventory and Monitoring of Services (14%) Mike McDonald Inventory, Map, and Forecast Ecosystem Services at multiple scales LTG 2 31% Modeling (5%) Tom Fontaine-- Consultation Committee Pollutant Specific Studies LTG 3 Nitrogen (6%) Jana Compton Eco-system Specific Studies LTG 4 Wetlands (22%) Janet Keough
Project Area Leads
Rick Linthurst and Iris Goodman Jana Compton Janet Keough Bill Fisher David Hammer Marc Russell Randy Bruins/ Betsy Smith Deborah Mangis Nita Tallent- Halsell Rick Linthurst and Iris Goodman Hal Walker: Place Based Coordinator
✔ ✔ ✔ ✔ ✔ ✔ ✔ ✔ ✔ ✔ ✔ ✔ ✔ ✔ ✔ ✔ ✔ ✔ ✔
✔
6
7
Conceptual Model for Wetland Services Relationships with Drivers, Stressors, and Human Well-Being
8
National & Regional Surveys of Wetland Condition
Abundance Distribution Type/Class Wetland Condition
Functions Water Cycling Nutrient Cycling Carbon Cycling Soil Formation 1° Production Habitat Biodiversity Services Water Quality Carbon Sequestration Wildlife Habitat Fisheries Support Flood/Storm Control
9
Ecosystem Service Wetland Metrics Carbon Storage
Carbon stocks in plants and soil / Carbon accretion to wetland soil; flux of GHG
Fisheries Support
Commercial / Recreational Fish or Shellfish Quantity / Fish – Shellfish Habitat Quality; Feedstock for C/R fisheries
Flood Control/Storm Surge Protection / Water Storage
Extent of Wetland Attenuation of Storm Surge or Flood, Water Volume Capacity of Wetlands
Water Quality Improvement
Reactive Nitrogen / Phosphorus Removal / Water Clarification; Pesticide Trapping
Wildlife Support
Birdwatching (Biodiversity) Opportunities / Wildlife Prey Abundance / Breeding Bird Community
10
salt marsh
mangrove
seagrass
beaches/bars/tidal flats
forested swamp
shrub swamp
inland marsh/wet meadow
floating/submerged vegetation From Dahl, 2006. Status and Trends of Wetlands in the Conterminous United States 1998-2004 Consistent with the EPA OW National Wetland Condition Assessment Categories These types comprise 98% of marine/estuarine wetlands and 94% of freshwater
THESE GENERAL TYPES VARY ACROSS ECOREGION, HYDROGEOMORPHIC SETTING, AREA, SALINITY-CONDUCTIVITY GRADIENT, SUCCESSIONAL STAGE
11
Wetland Wetland Classes Classes
Estuar Estuar Emerg Emerg Estuar Estuar Shrub Shrub Estuar Estuar Aquat Aquat Estuar Estuar flat flat Palust Palust Forest Forest Palust Palust Shrub Shrub Palust Palust Emerg Emerg Palust Palust Aq Aq Bed Bed
Carbon Carbon Storage Storage ✔ ✔ ✔ ✔ ✔ ✔ ✔ ✔ ✔ ✔ ✔ ✔ Fish Fish Support Support ✔ ✔ ✔ ✔ ✔ ✔ ✔ ✔ ✔ ✔ ✔ ✔ ✔ ✔ Storm Storm-
Flood -
Storage ✔ ✔ ✔ ✔ ✔ ✔ ✔ ✔ ✔ ✔ ✔ ✔ Water Water Quality Quality ✔ ✔ ✔ ✔ ✔ ✔ ✔ ✔ ✔ ✔ ✔ ✔ ✔ ✔ ✔ ✔ Wildlife Wildlife Support Support ✔ ✔ ✔ ✔ ✔ ✔ ✔ ✔ ✔ ✔ ✔ ✔ ✔ ✔ ✔ ✔
Regional and/or National Case Studies Regional and/or National Case Studies
12
The ability to use wetland condition indices (as monitored in the field) to estimate ecosystem service production in the field) to estimate ecosystem service production functions functions
The roles of location, pattern and connectivity of wetlands in delivery of multiple services in delivery of multiple services
Creation of wetland landscape profiles of services for most major classes of wetlands, over most of the conterminous major classes of wetlands, over most of the conterminous U.S. U.S.
Testing wetland landscape profiles for usefulness in predicting suites of wetland services at scales appropriate predicting suites of wetland services at scales appropriate for decision for decision-
making
13
14
15
Place Based Studies – Wetland E fforts
Opportunity for coordinated site work: Standardization, Scaling, Applicability Testing, Collective Strength,….
SW
16
17
Research Task Methods (the “how”)
Flood & Storm Surge Protection Model storm surge vulnerability of coastal Louisiana & Carolinas from coastal wetland extent, tropical storm probabilities, and storm surge reduction coefficients. Develop models of wetland volume to determine capacity of wetlands to store water Carbon sequestration Apply soil organic carbon accumulation rates to wetlands in agricultural landscapes in the upper Midwest. Water Quality & Nitrogen Cycling Develop spatially-explicit nitrogen removal model for wetlands based on intensive datasets in specific places and literature. Bundled wetland services Develop landscape models of bundled wetland services (waterfowl production, carbon storage, water quality, habitat, recreation) in Mississippi River basin (or other basins)
Factors that regulate delivery of nutrients to Great Lakes Coastal wetlands Anthropogenic activities in the Great Lakes basin
Agriculture Human population Point source pollution Atmospheric deposition
21
19
ECOSYSTEMS SERVICES RESEARCH PROGRAM
Mapping/modeling of: (Presence/Extent/Condition) Coastal wetland change using multi- spectral satellite data (in addition to soil moisture indices, NWI, presence of hydric soils, and other variables) (Ecosystem Services, including change) Storm surge protection (SSP) Wave energy and tidal energy attenuation, including analyses of sea level rise (SLR) Production of commercially and recreationally important fish and birds Pollutant accumulation/transformation Provisioning of human recreational benefits and human aesthetic benefits
Storm Surge Protection Sea Level Rise
Ric Lopez
Based on Baker et al 2006
Jay Christensen
20
21
ECOSYSTEMS SERVICES RESEARCH PROGRAM
10000 20000 30000
Year
2000 2010 2020 2030 2040 2050 Baseline 20% SAV loss, local 20% SAV loss, total area Loss of 10% marsh edge
Gulf of Mexico blue crab landings tons Jordan et al. 2009
23
Intact Marsh Fragmented Marsh Marsh Loss
max
Shrimp Yield Storm Surge Reduction
From V Engle, ORD GED
24
Identified 12,519 isolated Identified 12,519 isolated wetlands in 2600 km wetlands in 2600 km2
2 study
study area area
Used LiDAR LiDAR to ID to ID bathymetric profile bathymetric profile
Isolated wetlands storage capacity of 43,000,000 m capacity of 43,000,000 m3
3 of
water water
Isolated Wetland Profile
100 110 120 130 140 150 500 1000 1500 Distance (ft) Elevation (Ft)
Wetland Profile Average Elevation Average Perimeter Elevation Maximum Elevation (117.69 ft) (124.39 ft) (141.83 ft)
From Lane, Autrey et al
25
Marsh N Tall
Plant Species Richness
N Loadings due to Residential Dev
Denitrification Rates
Sediment Macro-Organic Matter
Soil Respiration Rates Peat Formation Wildlife Habitat Water Quality Maintenance Erosion & Flood Control Nitrogen Fixation Rates Short
Bare Spots Bare Spots
(e.g. nesting habitat for sharp-tailed & seaside sparrows)
From C. Wigand, ORD AED
26
r = +0.87 P < 0.05
2000 4000 6000 8000 10000 2000 4000 6000 8000 10000 12000
Denitrification Enzyme Activity (kgN ha-1 y-1)
2 4 6 8 1 10 100 1000 10000
N flux mmol m-2 d-1 Davis et al. 2004 Caffrey et al. 2007 N-Load (Kg N ha-1 y-1)
12000
From C. Wigand, ORD AED
27
28
Sampling Frame (Map for Selecting Sample Sites)
Status and Trends Enhancements
New Pacific Coast Plots
EPA is working in partnership with the U.S. Fish & Wildlife Service
* Each red dot is a 4 square mile plot that includes mapped wetlands, deepwater, and uplands.
29
The Wetland Assessment Distribution Will look a lot like Wadeable Streams Assessment
30
Natural features
vegetation
water body
Ecological Endpoints
supported
Ecological Production function Economic Production function Ecosystem Service Benefits
rare species
recreation days
Complementary goods and services
Quality Components
Habitat Quality
viability Value Components
population
substitutability
From Wainger and Boyd
31
Can ecosystem function/service be inferred from wetland type?
sites?
How does wetland condition affect ecosystem function/service?
types?
32
Nutrient, Sediment, Toxic Removal / Transformation
to estimate pollutant removal? For instance, Nitrogen removal, sediment trapping, etc.
appropriate for decision-making?
measured?
33