SLIDE 1 1
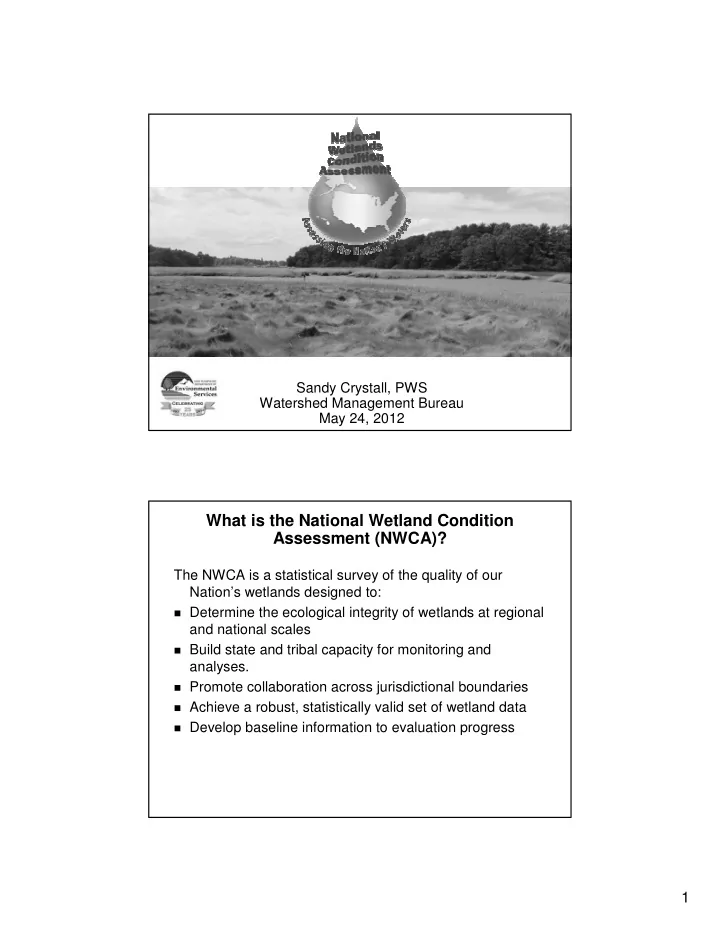
Sandy Crystall, PWS Sandy Crystall, PWS Watershed Management Bureau Watershed Management Bureau May 24, 2012 May 24, 2012
What is the National Wetland Condition What is the National Wetland Condition Assessment (NWCA)? Assessment (NWCA)?
The NWCA is a statistical survey of the quality of our The NWCA is a statistical survey of the quality of our Nation’s wetlands designed to: Nation’s wetlands designed to:
- Determine the ecological integrity of wetlands at regional
Determine the ecological integrity of wetlands at regional and national scales and national scales
- Build state and tribal capacity for monitoring and
Build state and tribal capacity for monitoring and analyses. analyses.
- Promote collaboration across jurisdictional boundaries
Promote collaboration across jurisdictional boundaries
- Achieve a robust, statistically valid set of wetland data
Achieve a robust, statistically valid set of wetland data
- Develop baseline information to evaluation progress
Develop baseline information to evaluation progress
SLIDE 2
2
NWCA Timeline NWCA Timeline No really, what is it? No really, what is it?
SLIDE 3 3
Applied Two Wetland Assessment Applied Two Wetland Assessment Methods Methods
- Level 2: USA RAM (rapid assessment method)
Level 2: USA RAM (rapid assessment method)
Twelve metrics
- Level 3: NWCA (intensive assessment method)
Level 3: NWCA (intensive assessment method)
What did we sample?
Vegetation
- Presence and abundance of plants (ground cover
Presence and abundance of plants (ground cover through tree canopy) through tree canopy)
Community complexity
- Algae collected from sediments and the surface of plant
Algae collected from sediments and the surface of plant stems and leaves stems and leaves
- Soil properties (and chemistry)
Soil properties (and chemistry)
- Surface water (chemistry)
Surface water (chemistry)
- Characterized assessment area and buffer
Characterized assessment area and buffer
Identified stressors
SLIDE 4 4
Pre Pre-
Sampling
- Site visits for verification of wetland presence, Cowardin
Site visits for verification of wetland presence, Cowardin class in target sampling population, and access class in target sampling population, and access
- Coordination with NHDES Watershed and Subsurface
Coordination with NHDES Watershed and Subsurface Bureau staff, NRCS staff and EPA Bureau staff, NRCS staff and EPA
Three-
- day EPA regional training in May
day EPA regional training in May
- Tentative schedule and logistics
Tentative schedule and logistics
Practice day
- Equipment inventory and purchases
Equipment inventory and purchases
Final site selection – – 11 sites with two of them revisit 11 sites with two of them revisit sites = 13 field surveys sites = 13 field surveys
Site Challenges: Access! Site Challenges: Access!
SLIDE 5 5
Dropped Sites Dropped Sites
- Access denied by landowner
Access denied by landowner
Water depth is >1m
- Assessment area is too small (<0.1 ha)
Assessment area is too small (<0.1 ha)
- Not a wetland (“Cowardin” definition)
Not a wetland (“Cowardin” definition)
- Treacherous blowdowns, insane number of hornets
Treacherous blowdowns, insane number of hornets nests, and walls of poison ivy all at one site nests, and walls of poison ivy all at one site
SLIDE 6
6
Establishment of Assessment Area Establishment of Assessment Area
SLIDE 7
7
Assessment Area Layouts Assessment Area Layouts
Narrow Polygon Narrow Polygon Wide Polygon Wide Polygon Wetland Wetland Boundary Boundary Establish Vegetation Plots and Soil Pits Establish Vegetation Plots and Soil Pits
Direction to walk within AA
SLIDE 8 8
Soils Soils
- Soil profile and physical
Soil profile and physical characteristics characteristics
- Hydric soil field indicators
Hydric soil field indicators
Soil chemistry and bulk density density
- Soil isotopes and enzymes
Soil isotopes and enzymes
SLIDE 9
9
Soil Data Sheets Soil Data Sheets
SLIDE 10
10
Flowcharts to Follow... Flowcharts to Follow... Soil Profile Description Soil Profile Description
SLIDE 11
11
From the representative soil pit, the samples From the representative soil pit, the samples came forth... came forth...
...and soil cores for isotope and sediment enzyme samples
bulk density samples
The really fun part... Carrying out the soil The really fun part... Carrying out the soil samples on a 90° day! samples on a 90° day!
SLIDE 12 12
Vegetation Vegetation
Vascular plant species presence presence
General cover estimates
Vascular plant species height and cover height and cover
Vertical strata data for vascular species vascular species
Bryophyte, lichen, epiphytes, and algae data epiphytes, and algae data
Ground surface attribute data data
Snag count and tree species presence, count species presence, count and cover and cover
Individual Vegetation Individual Vegetation Plots Plots
SLIDE 13
13
Pretty Easy Assessment Area Pretty Easy Assessment Area
SLIDE 14 14
Medium Not Medium Not-
So-
Bad Assessment Area Which plot am I in? Which plot am I in?
SLIDE 15 15
Establish Buffer Plots for Establish Buffer Plots for Characterization Characterization
Description of natural cover strata cover strata
Stressor Presence/Absence Presence/Absence
Residential/Urban
Hydrology
Agricultural/Rural
Industrial
Habitat Vegetation
Invasive Species
Water Quality
Characteristics of the surface water body Water sample for chemical analysis Maximum depth Surface water extent Field readings
SLIDE 16 16
Algae Algae
Taxonomic ID sample
Algal toxins sample
Chlorophyll-
a biomass sample
USA Rapid Assessment Method USA Rapid Assessment Method (USA (USA-
RAM)
- The primary purpose ... to assess wetland condition in a
The primary purpose ... to assess wetland condition in a shorter timeframe than required for more detailed shorter timeframe than required for more detailed sampling. sampling.
- Secondary purposes include:
Secondary purposes include:
- Exploring relationships between ecology, stress, and
Exploring relationships between ecology, stress, and buffers to demonstrate effects on condition. buffers to demonstrate effects on condition.
- Providing a RAM to US States and Tribes that they
Providing a RAM to US States and Tribes that they can further develop for their own purposes. can further develop for their own purposes.
SLIDE 17 17
USA RAM USA RAM
USA-
RAM
Overview Overview
SLIDE 18
18
RAM Metric 1: Percent of AA having buffer RAM Metric 1: Percent of AA having buffer
Completed in office Completed in office
RAM Metric 2: Buffer Width RAM Metric 2: Buffer Width
Completed in office Completed in office
SLIDE 19 19
RAM RAM Metric 3: Metric 3: Stressors in the Buffer Zone Stressors in the Buffer Zone
( (contd contd) )
- Stressors listed on RAM Metric 3 (Form 2) are ranked on
Stressors listed on RAM Metric 3 (Form 2) are ranked on a scale of 1, 2, or 3. a scale of 1, 2, or 3.
- For the sake of this Metric, the buffer zone is considered
For the sake of this Metric, the buffer zone is considered to be the entire 100m area around the AA, regardless of to be the entire 100m area around the AA, regardless of land use. land use.
Buffer Area assessed by RAM Metric 3: Buffer Area assessed by RAM Metric 3: Stressors in the Buffer Zone Stressors in the Buffer Zone
SLIDE 20 20
RAM RAM Metrics 4 Metrics 4-
12
- Focus on stressors within the AA
Focus on stressors within the AA
- Metric 4: Topographic Complexity
Metric 4: Topographic Complexity
- Metric 5: Patch Mosaic Complexity
Metric 5: Patch Mosaic Complexity
- Metric 6: Vertical Complexity
Metric 6: Vertical Complexity
- Metric 7: Plant Community Complexity
Metric 7: Plant Community Complexity
- Metric 8: Stressors to Water Quality
Metric 8: Stressors to Water Quality
- Metric 9: Alterations to Hydroperiod
Metric 9: Alterations to Hydroperiod
- Metric 10: Habitat /Substrate Alterations
Metric 10: Habitat /Substrate Alterations
- Metric 11: Percent Cover of Invasive Plant Species
Metric 11: Percent Cover of Invasive Plant Species
- Metric 12: Vegetation Disturbance
Metric 12: Vegetation Disturbance
USA RAM: Metric 4 USA RAM: Metric 4 Topographic Complexity Topographic Complexity
SLIDE 21
21
USA RAM: Metric 4 USA RAM: Metric 4 Topographic Complexity Topographic Complexity USA RAM: Metric 5 USA RAM: Metric 5 Patch Mosaic Complexity Patch Mosaic Complexity
SLIDE 22 22
USA RAM: Metric 6 USA RAM: Metric 6 Vertical Complexity Vertical Complexity
!"# # $!"% $!"%
&'%
((# #
& !%
)* * !% !%
&+', !%
)+',* * !% !%
USA RAM: Metric 7 USA RAM: Metric 7 Plant Community Complexity Plant Community Complexity
.'!" / /
Note: USEPA uses USDA PLANTS nomenclature
SLIDE 23 23
USA RAM: Metric 8 USA RAM: Metric 8 Stressors to Water Quality Stressors to Water Quality
.0' 1%2%' 1%2%' 2% 2%
USA RAM: Metric 9 USA RAM: Metric 9 Alterations to Hydroperiod Alterations to Hydroperiod
.'
1%2% '2% '2%
SLIDE 24 24
USA RAM: Metric 10 USA RAM: Metric 10 Habitat /Substrate Alterations Habitat /Substrate Alterations
. 1%2%'2 1%2%'2 % %
USA RAM: Metric 11 USA RAM: Metric 11 Percent Cover of Invasive Plant Species Percent Cover of Invasive Plant Species
. 3,'4'% 3,'4'%
'560 % %
SLIDE 25 25
USA RAM: Metric 12 USA RAM: Metric 12 Vegetation Disturbance Vegetation Disturbance
.
1%2% '2% '2%
Vegetation Vegetation – – Post Sampling Post Sampling
Plants pressed same day until dried. until dried.
Plants frozen to kill “hitchhikers,” labeled, and “hitchhikers,” labeled, and stored in herbarium stored in herbarium cabinet. cabinet.
- Identification of unknowns
Identification of unknowns
Exchange with VT for QA/QC checks QA/QC checks
2nd
nd DES botanist for spot
DES botanist for spot check check
SLIDE 26 26
Soils Post Soils Post-
Sampling
...SOP’s for how ...SOP’s for how to bag and staple to bag and staple soil samples for soil samples for shipping! shipping!
Now what? Now what?
- EPA’s national report due in late 2013.
EPA’s national report due in late 2013.
- Anticipate that it will be of very limited value on a
Anticipate that it will be of very limited value on a state level (Good, Fair, Poor) state level (Good, Fair, Poor)
- NHDES Watershed and Wetlands Bureau collaborating
NHDES Watershed and Wetlands Bureau collaborating with NH Heritage Bureau and UNH to begin developing with NH Heritage Bureau and UNH to begin developing state level monitoring and assessment tools. state level monitoring and assessment tools.
Long slow process – – starting with a lack of staff and starting with a lack of staff and resources for traditional monitoring. resources for traditional monitoring.
SLIDE 27 27
Overall value of NWCA Overall value of NWCA – – very high! very high!
- First experience with intensive wetland sampling
First experience with intensive wetland sampling
- Partnership and collaboration with NRCS
Partnership and collaboration with NRCS
- Collaboration among bureaus at NHDES
Collaboration among bureaus at NHDES
- Identified possible parameters to consider for developing
Identified possible parameters to consider for developing monitoring and assessment tools monitoring and assessment tools
- Additional experience with EPA National Aquatic
Additional experience with EPA National Aquatic Resource Surveys Resource Surveys
- It was a logistical challenge and hard field work, but it
It was a logistical challenge and hard field work, but it was fun too! was fun too!
NHDES: NHDES: Ted Walsh, Team Coordinator and Botany Assistant Ted Walsh, Team Coordinator and Botany Assistant Sandy Crystall, Ecologist/Botanist Sandy Crystall, Ecologist/Botanist Dave Neils Dave Neils Peg Foss Peg Foss Amy Smagula, QC of initial unknown plant species Amy Smagula, QC of initial unknown plant species Doug Smith, Soils Doug Smith, Soils Dawn Dawn Buker Buker, Soils , Soils Bill Meagher, Intern Bill Meagher, Intern Jessica Whitmore, Intern Jessica Whitmore, Intern Julie Swan, Intern Julie Swan, Intern USDA USDA-
NRCS: Joe Homer Joe Homer Karen Dudley Karen Dudley VT VT-
ANR: : Alan Alan Quackenbush Quackenbush, Plant QA , Plant QA