
SLIDE 1
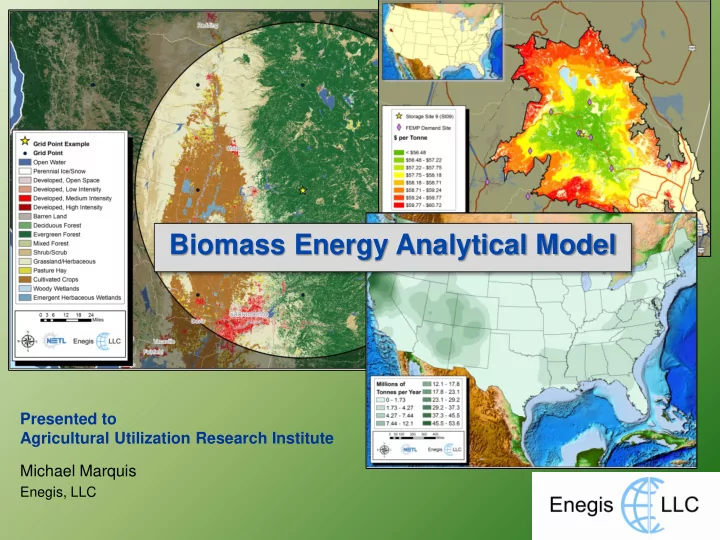
Presented to Agricultural Utilization Research Institute Michael Marquis
Enegis, LLC
Biomass Energy Analytical Model Presented to Agricultural - - PowerPoint PPT Presentation
Biomass Energy Analytical Model Presented to Agricultural Utilization Research Institute Michael Marquis Enegis, LLC BEAM - Goals BEAM was created to inform opportunities for National Energy Technology Laboratory (NETL)s Biomass &
Presented to Agricultural Utilization Research Institute Michael Marquis
Enegis, LLC
scales
Biomass Availability Module
supply at a given price Biomass Transport and Storage Module
along infrastructure and storage Biomass Demand Module
demand, and calculates price
Price/Demand Feedback Cost/Supply Feedback
Species Data Source Species Data Source Agriculture Residues: Agriculture Residues Cont: Hay All (Dry) USDA NASS Sweet Corn For Processing USDA NASS Hay Alfalfa (Dry) USDA NASS Wheat Winter All USDA NASS Rice All USDA NASS Sorghum For Grain USDA NASS Barley All USDA NASS Woody Residues: Canola USDA NASS Logging Residue - HardWood USDA FS Corn For Grain USDA NASS Logging Residue - SoftWood USDA FS Cotton Amer. Pima USDA NASS Forest Management Residue - HardWood BAMF Hazardous Fuels Cotton Upland USDA NASS Forest Management Residue - SoftWood BAMF Hazardous Fuels Beans Dry Edible USDA NASS Coarse Wood Residue - Hardwood BAMF Industrial Wood Waste Wheat Durum USDA NASS Coarse Wood Residue - Softwood BAMF Industrial Wood Waste Flaxseed USDA NASS Fine Wood Residue - Hardwood BAMF Industrial Wood Waste Peanuts for Nuts USDA NASS Fine Wood Residue - Softwood BAMF Industrial Wood Waste Potatoes All USDA NASS Urban Wood Waste - Tree clippings Based on US Census Bureau Population Hay Other (Dry) USDA NASS Oats - (Fall) USDA NASS Human Produced Wastes: Rye USDA NASS Wastewater Treatment Plants BAMF Anaerobic WWTP Safflower USDA NASS Landfills Producing Methane EPA Soybeans USDA NASS Sugarcane For Sugar USDA NASS Animal Manure: Sunflower All USDA NASS All Goats USDA NASS & HSIP Sweet Potatoes USDA NASS Milk Cows USDA NASS & HSIP Sugarbeets USDA NASS Beef USDA NASS & HSIP Wheat Other Spring USDA NASS Hogs All USDA NASS & HSIP Tobacco Air-Cured Light Burley USDA NASS Sheep USDA NASS & HSIP Tobacco Flue-Cured Class 1 USDA NASS Layer USDA NASS & HSIP Green Peas For Processing USDA NASS Broiler USDA NASS & HSIP Snap Beans For Processing USDA NASS Turkey USDA NASS & HSIP
USGS Land Cover—Landsat Thematic Mappper Highly detailed, comprehensive 30 meter resolution USGS Land Cover—Landsat Thematic Mappper Highly detailed, comprehensive 30 meter resolution
50 Miles
Agricultural Production by County Crops distributed to
Species-Specific Parameters
Hard and soft wood logging residue by county Residue distributed to appropriate forest type National Parks, wilderness, etc considered off limits
Hard and soft wood industrial residue by county Residue distributed to appropriate point type
Heads of Animals per County Manure distributed to point sources Species-Specific Parameters
North Dakota Alliance for Renewable Energy, I. (2009). "Biomass." Retrieved June 8, 2010, from http://www.ndare.org/NDARE%20PDFs/NDARE-BIOMASS%20Final.pdf. (2004). Wood Biomass for Energy. TechLine, Forest Products Laboratory.
BAM
BtuHHV BtuLHV Ash Avg Ash Min Ash Max Moisture Potassium (K ) Sodium (Na ) Chlorine (Cl ) Carbon (C ) Mercury (Hg) Sulfur (S) Species: MMBtu /Tonne MMBtu /Tonne % % % % g/kg (DAF) g/kg (DAF) weight % (DAF) weight % weight % (DAF) weight % (DAF) Logging Residue - HardWood 18.8 17.4 0.9 0.2 2.6 11.3 1.20 0.01 0.0 49.7 0.0 0.1 Logging Residue - SoftWood 19.9 18.5 1.6 0.4 4.1 4.7 1.68 0.25 0.0 51.9 0.0 0.0 Forest Mgmt. Residue - HardWood 18.8 17.4 0.9 0.2 2.6 11.3 1.20 0.01 0.0 49.7 0.0 0.1 Forest Mgmt. Residue - SoftWood 19.9 18.5 1.6 0.4 4.1 4.7 1.68 0.25 0.0 51.9 0.0 0.0 Coarse Wood Residue - Hardwood 18.5 17.2 0.9 0.4 2.1 15.2 0.98 0.04 0.0 50.0 0.0 0.1 Coarse Wood Residue - Softwood 19.3 18.0 0.3 0.3 0.3 9.3 0.38 0.04 0.0 49.8 0.0 0.0 Fine Wood Residue - Hardwood 17.2 16.0 1.5 8.0
0.0 0.0 Fine Wood Residue - Softwood 18.4 17.2 1.1 34.9 0.49 0.03 0.0 49.3 0.0 0.0 Urban Wood Waste - Tree clippings 19.5 18.4 15.6 1.4 39.4 35.4 4.15 2.05 0.1 51.1 0.0 0.1
Physical Parameters
Jan Feb Mar Apr May Jun Jul Aug Sep Oct Nov Dec Annual Total Species: % % % % % % % % % % % % % Hay All (Dry)
20 30 20 10 10
Hay Alfalfa (Dry)
20 30 20 10 5 5
Rice All
20 40 30
Sorghum For Grain
15 45 30
Barley All
50 25
Canola
30 30 20
Corn For Grain
50 25
Cotton Amer. Pima
50 15 15 100 Cotton Upland
50 15 15 100 Beans Dry Edible
50 25
Wheat Durum
50 25
Flaxseed
50
Peanuts for Nuts
50 25
Potatoes All
50 25
Hay Other (Dry)
20 30 20 10 10
Oats - (Fall)
50 25
Rye
50 25
Safflower
50
Soybeans
10 30 30 20 100 Sugarcane For Sugar 15 15 10 5
20 25 100 Sunflower All
20 50 25
Sweet Potatoes
50 25
Sugarbeets
50 25
Wheat Other Spring
50 25
Tobacco Air-Cured
50 25
Tobacco Flue-Cured
30 30 20
Green Peas For Processing 2 3 5 10 11 15 20 11 10 8 3 2 100 Snap Beans For Processing
5 7 20 30 20 10 3 2 1 100 Sweet Corn For Processing
10 30 30 10 10 5
Wheat Winter All
25 30 25 10
Seasonal Availability
BAM—L-48
Resultant Yield Lost Production Hay "All" (Dry) 1,112,221 1,000,999 111,222 Sorghum For Grain 10,705 9,902 803 Wheat "All" 62,978 58,255 4,723 Corn For Grain 1,008,574 958,145 50,429 Soybeans 570,757 542,219 28,538 Commodity Annual Tons 2008 USDA Total After Switchgrass Conversion
Capacity values in MW
Land cover / use
Biomass Cultivation, Harvest & In Situ Densification Transportation (Trucking) Processing & Storage Transportation (Truck, Rail, or Barge) Demand Plant
Wood Chips, Wood Bundles,
Agricultural Bundle
Biomass
Wood Chips, Wood Bundles,
Agricultural Bundle Pellets, Briquettes, Torrefied Briquettes,
Pellets, Briquettes, Torrefied Briquettes,
Process Stage & Calculations
To Farm/Forest Gate:
To Pre-Densification:
To Post-Densification:
To Plant Gate: 1. Delivery Cost
Producer Payment Storage Profit Credits/Allowances/Incentives
(2008). "Icon Easy: Easy Free Download High Quality Icons." Retrieved June 11, 2010, from http://www.iconeasy.com/. (2009). Affordable, Low-Carbon Diesel Fuel Domestic Coal and Biomass. Affordable, Low-Carbon Diesel Fuel Domestic Coal and Biomass. USDE/NETL.
– Increases the tonnes per truck load – Affects the outcome for cost, carbon footprint and energy efficiency for transport
– Option 1: pelletize
– Option 2: briquette
– Option 3: torrefaction
Energy Balance Carbon Footprint Energy Balance Carbon Footprint MBtu / tonne kg CO2 / tonne MBtu / tonne / mile kg CO2 / tonne / mile Wood Bundler 38.60 2.99 Wood Chipper - Small 79.50 6.15 Wood Chipper - Large 13.00 1.04 Wood As is 0.00 0.00 Ag Bundler - Gen 52.90 4.09 Ag Bundler - Grassy 73.40 5.68 Trucking Cost Description Wood Bundle 30.60 2.37 1.18 0.09 Wood Chips
0.09 Wood As Is 30.60 2.37 3.65 0.28 Ag Bundle 30.60 2.37 1.49 0.12 Pelletization with Chipper 3,800 358 Briquettization with Chipper 3,780 357 Torrefacation with Chipper 1,220 133 Pelletization 3,780 357 Briquettization 3,760 355 Torrefacation 1,200 132 Storage 30.60 2.37 Post-Densification
Activity
Truck Loading & Unloading Farm Gate Pre-Densification
CAPEX OPEX CAPEX OPEX OPEX Wood Bundler 0.89 13.78 Wood Chipper - Small 0.51 10.38 Wood Chipper - Large 0.08 0.64 Wood As is 0.00 0.00 Ag Bundler - Gen 1.64 8.6 Ag Bundler - Grassy 3.03 5.89 Trucking Cost Description Truck Labor Fuel, Insurance, etc. Wood Bundle 0.73 1.52 0.45 0.83 0.05 Wood Chips
0.45 0.83 0.05 Wood As Is 2.25 4.69 1.39 2.55 0.16 Ag Bundle 0.92 1.92 0.57 1.04 0.07 Pelletization with Chipper 12.31 36.16 Briquettization with Chipper 16.40 32.71 Torrefacation with Chipper 13.86 39.61 Pelletization 11.71 32.71 Briquettization 15.80 29.27 Torrefacation 13.27 36.16 Storage 6.91 2.20 $/tonne/mile Pre-Densification Post-Densification Farm Gate
$ / tonne $/tonne/hour Loading & Unloading
Biomass cost
Biomass carbon footprint
Biomass energy balance
Biomass cost
Biomass carbon footprint
Biomass energy balance
$62.04 366.8 kg CO2 3.97 MMBtu $63.72 366.2 kg CO2 3.97 MMBtu $66.46 370.7 kg CO2 4.02 MMBtu $63.56 366.0 kg CO2 3.96 MMBtu $64.55 367.6 kg CO2 3.98 MMBtu $67.64 372.6 kg CO2 4.05 MMBtu $66.88 371.4 kg CO2 4.03 MMBtu $65.25 368.7 kg CO2 4.00 MMBtu $63.44 365.8 kg CO2 3.96 MMBtu $63.44 365.8 kg CO2 3.96 MMBtu
All values per tonne
– Energy and economic decision analyses – Project Due Diligence – Resource assessments – Decision support models – Policy analysis – Scenario modeling – Strategy planning – Royalty evaluations – Technology assessments
– Energy resources and power generation
geothermal, solar, wind, geologic CO2
– Carbon capture and sequestration – Environment and energy rationalization – Policy analysis
– Testified before Congress – Presented to the White House and Department Secretaries – Presented to high-level executives
Michael Marquis Enegis, LLC 3959 Pender Dr. Suite 300 Fairfax, VA 22030 iPhone: 571-275-2055 MMarquis@Eengis.com www.Enegis.com
The work for BEAM was partially funded by the U.S. Department of Energy’s National Energy Technology Laboratory who is gratefully acknowledged.