Biology - the study of all living things Properties of Living - - PDF document

biology the study of all living things properties of
SMART_READER_LITE
LIVE PREVIEW

Biology - the study of all living things Properties of Living - - PDF document

2/18/2013 Biology - the study of all living things Properties of Living Organisms 1. Cellular structure and function Themes in Biology cell: basic unit of structure and function of organisms, capable of all life functions - covered by


slide-1
SLIDE 1

2/18/2013 1

Themes in Biology

Biology- the study of all living things

Properties of Living Organisms

  • 1. Cellular structure and function

cell: basic unit of structure and function of organisms,

capable of all life functions

  • covered by membranes
  • some organisms are unicellular or multicellular
  • 2. Reproduction - process by which organisms make more of the

same organism

  • essential for life since no organism lives forever
  • 3. Metabolism- sum of all chemical reactions in an organism
  • sun: main source of energy for all organisms to fuel

chemical reactions Ex: plants capture suns energy and make glucose which we eat

  • 4. Maintain homeostasis - constant internal environment in an organism
  • organisms must respond to external environment to

survive Ex: arctic seals- blubber cactus- heavy waterproof layer

  • 5. Heredity – passing of traits from parent to offspring
  • controlled by genes (proteins) on DNA
  • can be affected by mutations

Mutations – change in the DNA which can be harmful or beneficial Ex: sickle cell anemia Bad- rbc do not carry oxygen properly Good- give resistance to malaria sex cell mutations are passed on to offspring autosomal mutations are not passed to offspring

  • 6. Evolution – gradual change in a species over a period of time

Species: group of genetically similar organisms that can produce fertile

  • ffspring

Darwin- said evolution occurred through natural selection

  • Organisms with favorable genes survived, reproduced,

and passed favorable genes to offspring.

  • 7. Interdependence – organisms dependence on each other within an environment

Purposes of Biology To solve real world problems:

  • A. Studying ecosystems
  • B. Genetically engineered crops
  • C. Help fight diseases
  • AIDS
  • Cancer
  • Cystic fibrosis

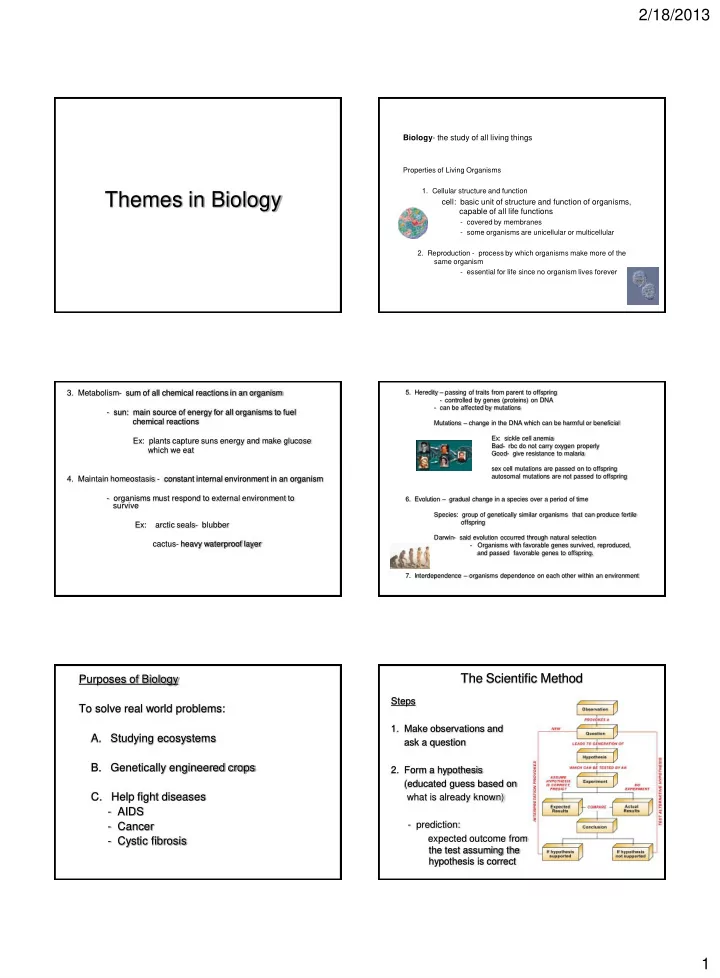
The Scientific Method

Steps

  • 1. Make observations and

ask a question

  • 2. Form a hypothesis

(educated guess based on what is already known)

  • prediction:

expected outcome from the test assuming the hypothesis is correct

slide-2
SLIDE 2

2/18/2013 2

  • 3. Test the hypothesis thru

experimentation

  • controlled experiment
  • A. control group:

“normal condition”

  • receives no experimental

treatment or change in condition

  • B. experimental group:

“test group”

  • variable/ experimental factor

being tested for

  • a. independent variable:

factor being varied

  • b. dependant variable:

factor being measured

  • 4. Collect and analyze data
  • use charts, tables,
  • bservations
  • 5. Draw conclusions

(formation of a theory)

  • can support or reject

hypothesis

  • can be disproven

through further experimentation

  • 6. Share results or retest
  • publish data in scientific

journals

Representing Data Graphically Charts/Graphs

There are three basic components to most charts/graphs:

  • Labels- defines the data:
  • title, axis titles and labels, legends defining

separate data series

  • Scales- define the range of the Y and the X axis
  • Graphical elements- represent the data
  • bars in bar charts
  • lines in times series plot
  • points in scatter plots
  • slices of a pie chart

Pie Charts

Bar Graphs

Line Graphs

School System Enrollment

slide-3
SLIDE 3

2/18/2013 3

Scatter Plots (x,y) Scatter Plots (x,y)

Rules for Scatterplots (shows relationship between variables)

  • Use two interval-level variables (x and y)
  • Fully define the variables with the axis titles
  • Chart title should identify the two variables and the cases (e.g., cities
  • r states)
  • X axis: independent variable (cause)

Y axis: dependent variable (result)

  • Scale the axes to maximize the use of the plot area for displaying the

data points

  • Use same interval measurements on each axis
  • Do NOT connect dots, use a trend line

Scatter Plot Trend Lines

NEGATIVE indirect relationship (+, -) NULL POSITIVE no direct relationship relationship (0,0) (+, +)

Theory

  • Explanation based on a set of related hypotheses that

have been tested and confirmed many times but can be broken.

  • Theories unite and explain a broad range of
  • bservations
  • Scientific theories are generally accepted as scientific

principle whereas to the general public, theories are considered statements of uncertainty

Scientific Law summarizing statement that is considered fact and can not be broken Ex: gravity

Measurement

“Eventually we will have to exchange our feet for meters”

slide-4
SLIDE 4

2/18/2013 4

Measurement

  • System International (SI)
  • standardized system of measurement
  • based on the number 10
  • France, late 1700’s

SI Prefixes