
SLIDE 1
Between Demography and Consumption: Digital and Quantitative - - PowerPoint PPT Presentation
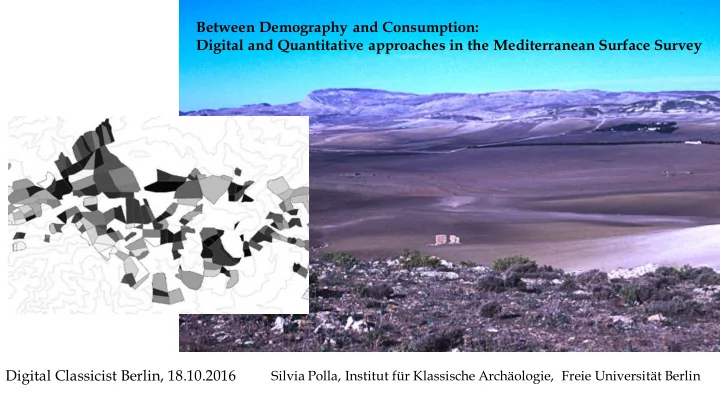
Between Demography and Consumption: Digital and Quantitative approaches in the Mediterranean Surface Survey Digital Classicist Berlin, 18.10.2016 Silvia Polla, Institut fr Klassische Archologie, Freie Universitt Berlin Hobson 2012 Hobson
Economic structure Location Economic mechanism Archaeological correlates Imperial Economy Empirewide and beyond frontiers Taxation, imperial exploitation
resources, redistribution, largesse, and salary commitments Monetization focused
gathering (Egyptian tax grain arrangements, etc.); long range movement
to frontier provinces or Rome, military bias in distribution patterns Extraprovincial Economies Empirewide and beyond frontiers Free-market economy, response to
exchange Interprovincial movement
markets, consumption of imported goods on civilian sites Provincial Economies Within provincial borders, often localized around major towns Free-market economy, response to taxation, monetization Local market distributions
goods, spread of monetization to smaller market centers
192; 75% 65; 25% good soils bad soils
22 1 6 6 2 2 1 2 6 5 10 15 20 25 Flat North North-East East South-East South West North-West North Nr Farms (tot = 48 belonging to the Vandal- Byzantine Phase)
Test on 257 „farms“, all periods
Insch Press CW ACW HM BGW IS GLA CBM DW AMPH PW LA
ARS correlation coefficient
,153** ,318** ,892** ,506** ,484** ,193** ,337** ,444** ,683** ,446** ,772** ,153** ,523**
15,77% 38,56% 0,65% 1,72% 0,08% 0,25% 1,15% 7,97% 0,57% 27,77% 0,05% 0,41% 2,50% 2,01% 0,53% 0,01%
ARS CW ACW HM BGW IS GLA CBM DW AMPH PW LA MW M OS TW
>>Very poor assemblages
Single Variables: „Location“ + „Size“ + „Slope“ + „Inscriptions“+ „Oil presses“ + „Ceramic Classes („ARS","CW","ACW","HM","BGW","IS","GLA","CBM“,"DW","AMPH","PW","LA","TW„)“, + + „Phase1",„Phase2",„Phase3",„Phase4",„Phase5",„Phase6",„Phase7" Group 1: 119 Group 2: 10 Group 3: 44
20 40 60 80 100 120 140 160 Early Roman Middle Roman Late Roman Vandal Byzantine Islamic New Continuing Reoccupied Abandoned 20 40 60 80 100 120 140 Pre-Roman Early Roman Middle Roman Late Roman Vandal Byzantine Islamic Total sites
Byzantine
1 2 3 4 5 6 year 60 year 75 year 90 year 105 year 120 year 135 year 150 year 165 year 180 year 195 year 210 year 225 year 240 year 255 year 270 year 285 year 300 year 315 year 330 year 345 year 360 year 375 year 390 year 405 year 420 year 435 year 450 year 465 year 480 year 495 year 510 year 525 year 540 year 555 year 570 year 585 year 600 year 615 year 630 year 645 year 660 year 675 year 690
2.5 2.5
Survey Intensity/ Number of sites Visibility / Number of sites
2. 5 2. 5
Mapalia, El Alia (Mahdia, II AD).
Ceramics/ha