
SLIDE 1
To transform Santa Cruz County into a world-class active transportation community
at 41 st Avenue To transform Santa Cruz County into a OUR VISION - - PowerPoint PPT Presentation
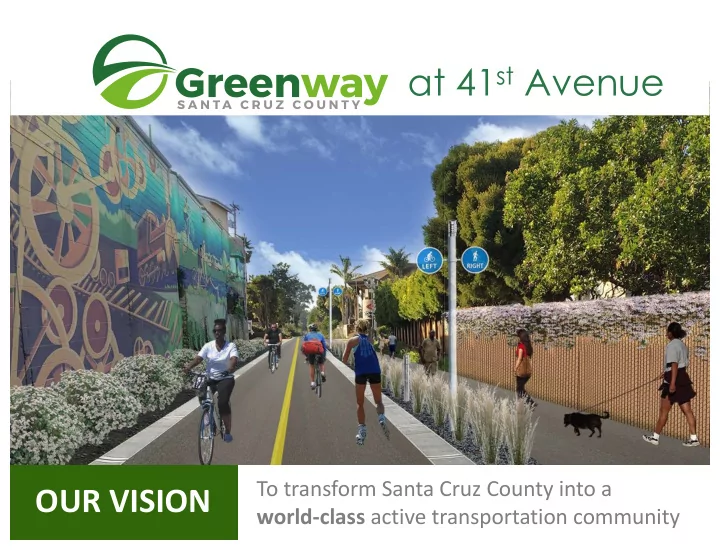
at 41 st Avenue To transform Santa Cruz County into a OUR VISION world-class active transportation community WHO WE ARE BUD COLLIGAN Greenway Board Member, CEO South Swell Ventures, Co-Chair, Monterey Bay Economic Partnership, Founding Board
To transform Santa Cruz County into a world-class active transportation community
Greenway Board Member, CEO South Swell Ventures, Co-Chair, Monterey Bay Economic Partnership, Founding Board Member, Santa Cruz Works; community activist & philanthropist for arts, environment, education, affordable housing, social equity, and transportation
Greenway Board Member, 17-year resident of Santa Cruz County, mathematics degree, commercial real estate appraiser, extensive background in “highest and best use analysis”
Jacob Martinez, Lloyd Tabb, Doug Erickson, Gayle Ortiz, Patrice Boyle, Robert Stephens, Miles Reiter, William Ow, Bill Simpkins, Ted Burke, Tyler Fox, Dr. Robert Quinn,
To create a spectacular Greenway as the backbone of a safe, scenic, and efficient active transportation network
1 2 3 4 5 6 7 Protected bicycle lanes connecting Greenway to our major employers, schools, and destinations are needed to create a safe, efficient active transportation network
EXISTING RIVER TRAIL
Wide Trail Narrow Trail Separates Users Mixes Users Preserves Trees, Plants, Soil Removes Trees, Plants, Soil No Fencing Fencing No New Retaining Walls Extensive Retaining Walls
Linear Park Utilitarian Path Transportation Recreation Allows Connections Limited Connections Uses Existing Bridges Requires 24 New Bridges 100% Funded - Measure D Not 100% Funded Preserves Future Options Preserves Future Options
Source: Rail Transit Feasibility Study, pg. 108
ID Scenari0 Trains/Day Low High B SC – Cap 60 1,400 1,700 D SC – Wats (Peak) 24 550 675 E SC – Aptos 60 2,350 2,575 G SC – Wats (Exp) 2,500 2,750 J SC – Pajaro 12 875 975 S SC – Sea Cliff 38 700 800 G SC – Wats (Exp) 60 2,500 2,750
ID Scenari0 Trains/Day Low High B 60 1,850 2,150 D SC – Wats (Peak) 24 650 800 E SC – Aptos 60 2,950 3,200 G SC – Wats (Exp) 60 3,075 3,400 J SC – Pajaro 12 1,125 1,250 S SC – Sea Cliff 38 1,000 1,100
Source: Rail Transit Feasibility Study, pg. 108
G SC – Wats (Exp) 60 3,075 3,400
Source: Rail Transit Feasibility Study, pg. 114
Right of Way, Parking, Fences, Quiet Zones, Inflation, Interest, 40% Average Overruns MBSST ........................... $127M PRFS ............................. $176M $12M net O & M x 30 years …. $360M Total ............................. $663M LAST MILE $663M+ Not Covered: Not Covered
Source: MBSST; Rail Transit Feasibility Study; DOT
Section 8.2.4 of the RTFS states: “While rail transit lines can be electrified the costs can be prohibitive, especially for smaller systems. The cost for constructing electric light rail and modern streetcar lines ranges from $50M to $100M per mile and up. Given traditional funding sources, neither of these technologies is cost-effective for the Santa Cruz line at this time.”
– Subject: Santa Cruz Branch Abandonment – Provides legal standard and procedures for abandonment – Indicates 3 to 6 months for STB decision
– Subject: Potential Abandonment of the Santa Cruz Subdivision – Addresses probability of abandonment being approved – Concludes there is “no chance” the STB would deny abandonment application
August 23, 2010 – Section 6.8.1(a)(ii) – Allows for abandonment
September 27, 2012 – Section 8.3: Abandonment – Allows for railbanking as part of the abandonment process
Per Section 6.1.2 of the RTFS: Replacement of all rail to be used for passenger service was assumed as part of the analysis (6.1.2.2). Existing ties are not suitable for the higher forces generated by higher rail vehicle speeds and increased passenger traffic contemplated by the operating plan (6.1.2.2.1).
WA TSONVILLE SANT A CRUZ CAPITOLA
1 152SCOTTSVALLEY
917
REACH1
319 147 236 147 895 500
LEGEND
51-100 common commute trips 101-200 common commute trips 201-2709common commute trips =100 bicyclists2,247 1,614
Existing Recreationalor Utilitarian Cyclists
to shift to the trail
NewCyclists
to shift from
NORTHERNREACH CENTRALREACH SOUTHERNREACH
1 2 Miles
Existing Recreationalor Utilitarian Cyclists NewCyclists
to shift from
Existing Recreationalor Utilitarian Cyclists NewCyclists
to shift from
NewCyclists
to shift from
(Low Estimate)
Existing Recreationalor Utilitarian Cyclists
REACH2 REACH3 REACH4
We couldexpect
to shift to the trail
We couldexpect
to shift to the trail
We couldexpect
to shift to the trail
We couldexpect
17 9Source: Nelson Nygaard 2016 using NCHRP Demand Model
WA TSONVILLE SANT A CRUZ CAPITOLA
1 152SCOTTSVALLEY
917
REACH1
1.470 500 1,075 490 4,110 1,685
LEGEND
51-100 common commute trips 101-200 common commute trips 201-2709common commute trips =100 bicyclists10,320 5,450
Existing Recreationalor Utilitarian Cyclists
to shift to the trail
NewCyclists
to shift from
NORTHERNREACH CENTRALREACH SOUTHERNREACH
1 2 Miles
Existing Recreationalor Utilitarian Cyclists NewCyclists
to shift from
Existing Recreationalor Utilitarian Cyclists NewCyclists
to shift from
NewCyclists
to shift from
(Midpoint Estimate)
Existing Recreationalor Utilitarian Cyclists
REACH2 REACH3 REACH4
We couldexpect
to shift to the trail
We couldexpect
to shift to the trail
We couldexpect
to shift to the trail
We couldexpect
17 9Source: Nelson Nygaard 2016 using NCHRP Demand Model
Let’s build Greenway to plan for evolving technologies and attract a new generation of residents and businesses
pays disproportionally for service it doesn’t use
roundtrip fare (20 mile Santa Rosa to Novato on SMART): annualized $3,465
$3,465/year
to bike for transportation as all other income groups
area (SC – Aptos) improving flow from South County
most flexible, expedient, and economically viable solution
Bike Trail is 25 miles and averaging > 2,000 riders per day). Offer subsidies to buy electric bikes.
protected bike lanes from Greenway to major employers, schools, and other popular destinations to create a true active transportation network
“Once the funds are refunded RTC may use the Santa Cruz Branch Line and/or any of its facilities for any lawful purpose.” “The CTC is willing to work with the RTC to develop a solution to any issues affecting this transportation corridor.”
1. Continue with Phase 1 of Segment 7 & Watsonville 2. Stop work on remaining segments until UCS is completed and peer reviewed 3. Negotiate IP buyout 4. File for abandonment and railbank the corridor 5. Amend/Revise Master Plan & EIR 6. Remove rails and ties; begin using path immediately as design and construction continue on various segments 7. Build trail envisioned by Greenway
Myth #1: A train will dramatically relieve congestion on Hwy 1. FALSE. RTC’s study shows only 2,750 daily roundtrips, of which only 300 are Watsonville to SC commuters. The mid-point estimates for Greenway ridership show what’s possible with an active transportation network. Myth #2: We have to build a trail next to the tracks to preserve the option for future rail service. FALSE. Railbanking has been used by other communities nationwide to preserve all future rail options. We have received guidance from legal counsel and the STB regarding process and procedures to implement. Myth #3: A train is the only way to serve low income residents of south county. FALSE. Trains are one of the most costly ways to serve low income residents. Typical fares will total over $3,465 per year (1), NOT including any first mile or last mile costs. A sales tax to fund operating deficits is the MOST REGRESSIVE form
disproportionately on south county residents. Residents making < $20K per year have twice the bike usage as those who make more. Bike = $300/year. METRO = $715/year. Myth #4: The trail portion of the Rail-with-Trail plan is one contiguous trail. FALSE. The MBSST trail will go onto busy streets at trestles and workaround points. If Segment 17B is implemented (likely), south county essentially gets NO TRAIL and is detoured onto streets with cars going 60 MPH (San Andreas Rd) and no bike lane (Beach Rd). Myth #5: We will likely get federal and state money to pay for a train. HIGHLY UNLIKELY. Due to low county population and forecasted ridership, we will rank low in securing competitive grants.
Myth #6: We are obligated to implement a train due to Proposition 116 funds. FALSE. We can return the $11M of Prop 116 funds to the CTC and save $700M+ over 30 years. Myth #7: The RTFS was preliminary and that’s not what we really want to do. We expect to use “green-based track technology.” Whopper Alert! Section 8.2.4 of the RTFS states: “While rail transit lines can be electrified the costs can be prohibitive, especially for smaller systems. The cost for constructing electric light rail and modern streetcar lines ranges from $50M to $100M per mile and up. Given traditional funding sources, neither of these technologies is cost-effective for the Santa Cruz line at this time.” Myth #8: We need to keep the tracks and ties for future rail. FALSE. Existing railroad track and ties would be replaced. Per Section 6.1.2 of the RTFS: Replacement of all rail to be used for passenger service was assumed as part of the analysis (6.1.2.2). Existing ties are not suitable for the higher forces generated by higher rail vehicle speeds and increased passenger traffic contemplated by the operating plan (6.1.2.2.1). Myth #9: It’s too hard and will take too long to change the existing public process. REALLY? All it takes is political will. It will be enormously more expensive and destructive to build the wrong trail.