Announcements U nit 2: P robability and distributions L ecture 1: P - - PowerPoint PPT Presentation

announcements u nit 2 p robability and distributions l
SMART_READER_LITE
LIVE PREVIEW

Announcements U nit 2: P robability and distributions L ecture 1: P - - PowerPoint PPT Presentation

Announcements U nit 2: P robability and distributions L ecture 1: P robability and conditional probability Turn in PS 2 S tatistics 101 We will start Lab 2 today Nicole Dalzell May 19, 2015 Statistics 101 ( Nicole Dalzell ) U2 - L1:


slide-1
SLIDE 1

Unit 2: Probability and distributions Lecture 1: Probability and conditional probability Statistics 101

Nicole Dalzell May 19, 2015

Announcements

Turn in PS 2 We will start Lab 2 today

Statistics 101 ( Nicole Dalzell ) U2 - L1: Probability May 19, 2015 2 / 1 Probability Randomness

Random processes

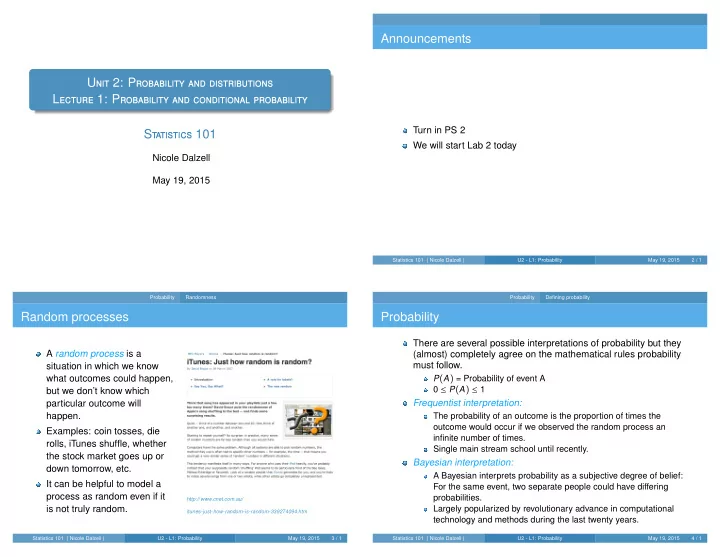
A random process is a situation in which we know what outcomes could happen, but we don’t know which particular outcome will happen. Examples: coin tosses, die rolls, iTunes shuffle, whether the stock market goes up or down tomorrow, etc. It can be helpful to model a process as random even if it is not truly random.

http://www.cnet.com.au/ itunes-just-how-random-is-random-339274094.htm Statistics 101 ( Nicole Dalzell ) U2 - L1: Probability May 19, 2015 3 / 1 Probability Defining probability

Probability

There are several possible interpretations of probability but they (almost) completely agree on the mathematical rules probability must follow.

P(A) = Probability of event A 0 ≤ P(A) ≤ 1

Frequentist interpretation:

The probability of an outcome is the proportion of times the

  • utcome would occur if we observed the random process an

infinite number of times. Single main stream school until recently.

Bayesian interpretation:

A Bayesian interprets probability as a subjective degree of belief: For the same event, two separate people could have differing probabilities. Largely popularized by revolutionary advance in computational technology and methods during the last twenty years.

Statistics 101 ( Nicole Dalzell ) U2 - L1: Probability May 19, 2015 4 / 1

slide-2
SLIDE 2

Probability Law of large numbers

Participation question Which of the following events would you be most surprised by? (a) 3 heads in 10 coin flips (b) 3 heads in 100 coin flips (c) 3 heads in 1000 coin flips

Statistics 101 ( Nicole Dalzell ) U2 - L1: Probability May 19, 2015 5 / 1 Probability Law of large numbers

Law of large numbers

Law of large numbers states that as more observations are collected, the proportion of occurrences with a particular outcome, ˆ pn, converges to the probability of that outcome, p.

Statistics 101 ( Nicole Dalzell ) U2 - L1: Probability May 19, 2015 6 / 1 Probability Law of large numbers

Law of large numbers vs. law of averages

When tossing a fair coin, if heads comes up on each of the first 10 tosses, what do you think the chance is that another head will come up on the next toss? 0.5, less than 0.5, or more than 0.5? H H H H H H H H H H ? The probability is still 0.5, or there is still a 50% chance that another head will come up on the next toss. P(H on 11th toss) = P(T on 11th toss) = 0.5 The coin is not due for a tail. The common (mis)understanding of the LLN is that random processes are supposed to compensate for whatever happened in the past; this is just not true and is also called gambler’s fallacy (or law of averages).

Statistics 101 ( Nicole Dalzell ) U2 - L1: Probability May 19, 2015 7 / 1 Probability Disjoint and non-disjoint outcomes

Disjoint and non-disjoint outcomes

Disjoint (mutually exclusive) outcomes: Cannot happen at the same time. The outcome of a single coin toss cannot be a head and a tail. A student cannot fail and pass a class. A card drawn from a deck cannot be an ace and a queen. Non-disjoint outcomes: Can happen at the same time. A student can get an A in Stats and A in Econ in the same semester.

Statistics 101 ( Nicole Dalzell ) U2 - L1: Probability May 19, 2015 8 / 1

slide-3
SLIDE 3

Probability Disjoint and non-disjoint outcomes

Participation question

What is the probability that a randomly sampled student thinks marijuana should be legalized or they agree with their parents’ political views?

Parent Politics Legalize MJ No Yes Total No 11 40 51 Yes 36 78 114 Total 47 118 165

(a)

40+36−78 165

(b)

114+118−78 165

(c)

78 165

(d)

78 188

(e)

11 47

Statistics 101 ( Nicole Dalzell ) U2 - L1: Probability May 19, 2015 9 / 1 Probability Probability distributions

Participation question In a survey, 52% of respondents said they are Democrats. What is the probability that a randomly selected respondent from this sample is a Republican? (a) 0.48 (b) more than 0.48 (c) less than 0.48 (d) cannot calculate using only the information given

Statistics 101 ( Nicole Dalzell ) U2 - L1: Probability May 19, 2015 10 / 1 Probability Probability distributions

Disjoint vs. complementary

Do the sum of probabilities of two disjoint events always add up to 1? Do the sum of probabilities of two complementary events always add up to 1?

Statistics 101 ( Nicole Dalzell ) U2 - L1: Probability May 19, 2015 11 / 1 Probability Independence

Independence

Two processes are independent if knowing the outcome of one provides no useful information about the outcome of the other.

coin flips are independent card draws (without replacement) are dependent

Independence and disjointness do not mean the same thing:

independent events do not affect each other disjoint (mutually exclusive) events cannot happen at the same time

Statistics 101 ( Nicole Dalzell ) U2 - L1: Probability May 19, 2015 12 / 1

slide-4
SLIDE 4

Probability Independence

Participation question

Between January 9-12, 2013, SurveyUSA interviewed a random sample of 500 NC residents asking them whether they think widespread gun ownership protects law abiding citizens from crime, or makes society more dangerous. 58% of all respondents said it protects citizens. 67% of White respondents, 28% of Black respondents, and 64% of Hispanic respondents shared this

  • view. Which of the below is true?

Opinion on gun ownership and race ethnicity are most likely (a) complementary (b) mutually exclusive (c) independent (d) dependent (e) disjoint

http://www.surveyusa.com/client/PollReport.aspx?g=a5f460ef-bba9-484b-8579-1101ea26421b Statistics 101 ( Nicole Dalzell ) U2 - L1: Probability May 19, 2015 13 / 1 Probability Independence

Checking for independence If P(A | B) = P(A), then A and B are independent.

Statistics 101 ( Nicole Dalzell ) U2 - L1: Probability May 19, 2015 14 / 1 Probability Independence

Evaluating dependence based on sample data

Conditional probabilities calculated based on sample data suggest dependence → conduct a hypothesis test to determine if the

  • bserved difference is unlikely to have happened by chance.

We have seen that P(protects citizens | White) = 0.67 and P(protects citizens

| Hispanic) = 0.64. Under which condition would you be more convinced of

a real difference between the proportions of Whites and Hispanics who think gun widespread gun ownership protects citizens? n = 500 or n = 50, 000

Large observed difference → hypothesis test will likely be significant. Small observed difference, and

n large → hypothesis test may be significant. n small → then hypothesis test will likely not be significant.

Statistics 101 ( Nicole Dalzell ) U2 - L1: Probability May 19, 2015 15 / 1 Probability Independence

Participation question

A 2012 Gallup poll suggests that 19.4% of North Carolinians don’t have health

  • insurance. Assuming that the uninsured rate stayed constant, what is the

probability that two randomly selected North Carolinians are both uninsured?

(a) 19.42 (b) 0.1942 (c) 0.194 × 2 (d) (1 − 0.194)2

http://www.gallup.com/poll/125066/ State-States.aspx?ref=interactive Statistics 101 ( Nicole Dalzell ) U2 - L1: Probability May 19, 2015 16 / 1

slide-5
SLIDE 5

Probability Recap

Participation question

In a NC emergency room, 5 patients are waiting to be seen. Assuming that these patients constitute a random sample, what is the probability that at least

  • ne is uninsured?

(a) 1 − 0.194 × 5 (b) 1 − 0.1945 (c) 0.8065 (d) 1 − 0.806 × 5 (e) 1 − 0.8065

Statistics 101 ( Nicole Dalzell ) U2 - L1: Probability May 19, 2015 17 / 1 Marginal, joint, conditional

Relapse

Researchers randomly assigned 72 chronic users of cocaine into three groups: desipramine (antidepressant), lithium (standard treatment for cocaine) and placebo. Results of the study are summarized below.

no relapse relapse total desipramine 10 14 24 lithium 18 6 24 placebo 20 4 24 total 48 24 72

http://www.oswego.edu/ ∼srp/stats/2 way tbl 1.htm Statistics 101 ( Nicole Dalzell ) U2 - L1: Probability May 19, 2015 18 / 1 Marginal, joint, conditional

Marginal probability

What is the probability that a patient relapsed?

no relapse relapse total desipramine 10 14 24 lithium 18 6 24 placebo 20 4 24 total 48 48 24 72 72

P(relapsed) = 48

72 ≈ 0.67

Statistics 101 ( Nicole Dalzell ) U2 - L1: Probability May 19, 2015 19 / 1 Marginal, joint, conditional

Joint probability

What is the probability that a patient received the the antidepressant (desipramine) and relapsed?

no relapse relapse total desipramine 10 10 14 24 lithium 18 6 24 placebo 20 4 24 total 48 24 72 72

P(relapsed and desipramine) = 10

72 ≈ 0.14

Statistics 101 ( Nicole Dalzell ) U2 - L1: Probability May 19, 2015 20 / 1

slide-6
SLIDE 6

Marginal, joint, conditional

Conditional probability

If we know that a patient received the antidepressant (desipramine), what is the probability that they relapsed?

no relapse relapse total desipramine 10 10 14 24 24 lithium 18 6 24 placebo 20 4 24 total 48 24 72

P(relapsed | desipramine) = 10

24 ≈ 0.42

P(relapsed | lithium) = 18

24 ≈ 0.75

P(relapsed | placebo) = 20

24 ≈ 0.83

Statistics 101 ( Nicole Dalzell ) U2 - L1: Probability May 19, 2015 21 / 1 Marginal, joint, conditional

Conditional probability

If we know that a patient relapsed, what is the probability that they received the antidepressant (desipramine)?

no relapse relapse total desipramine 10 10 14 24 lithium 18 6 24 placebo 20 4 24 total 48 48 24 72

P(desipramine | relapsed) = 10

48 ≈ 0.21

P(lithium | relapsed) = 18

48 ≈ 0.375

P(placebo | relapsed) = 20

48 ≈ 0.42

Statistics 101 ( Nicole Dalzell ) U2 - L1: Probability May 19, 2015 22 / 1