
SLIDE 1
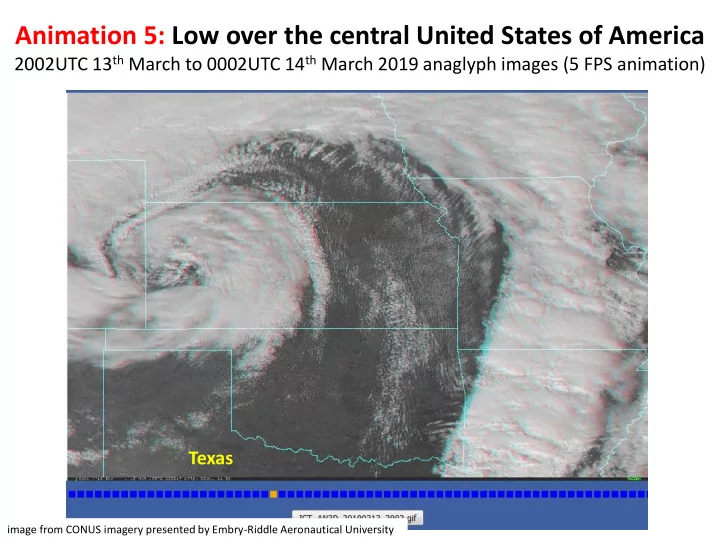
Animation 5: Low over the central United States of America
2002UTC 13th March to 0002UTC 14th March 2019 anaglyph images (5 FPS animation)
image from CONUS imagery presented by Embry-Riddle Aeronautical University
Animation 5: Low over the central United States of America 2002UTC 13 - - PowerPoint PPT Presentation
Animation 5: Low over the central United States of America 2002UTC 13 th March to 0002UTC 14 th March 2019 anaglyph images (5 FPS animation) Texas image from CONUS imagery presented by Embry-Riddle Aeronautical University Animation 6:
image from CONUS imagery presented by Embry-Riddle Aeronautical University
image from CONUS imagery presented by Embry-Riddle Aeronautical University
image from Google Earth image from Viri Virtual Reality Melbourne facebook post
anaglyph images from CONUS imagery presented by Embry-Riddle Aeronautical University Non-anaglyph images from CIMSS Satellite Blog, case studies produced by Scott Lindstrom SSEC