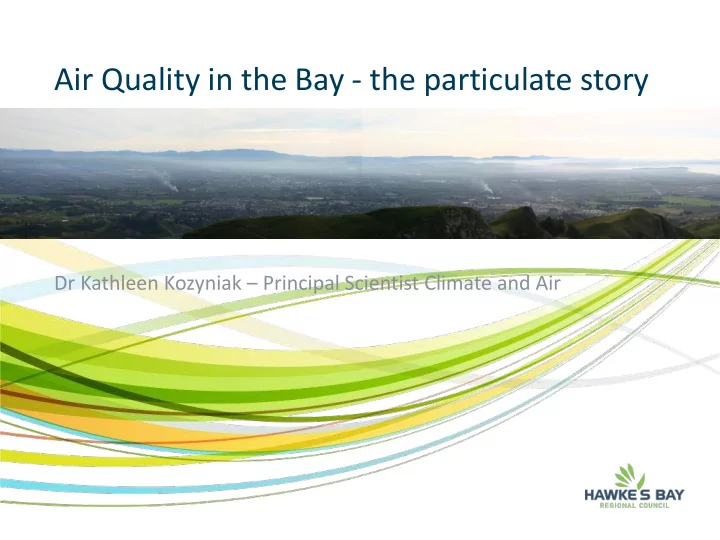

Air Quality in the Bay - the particulate story Dr Kathleen Kozyniak – Principal Scientist Climate and Air
RED ALERT BEIJING Page Title Here With “AIRPOCALYPSE” (GREENPEACE) Leading Capitals Like This: Page content here like this. Fixed width as shown here if possible. Depth varies depending on content. Footer varies to maintain page interest and accommodate varying content. You ideally don’t want too much text per page, so break up content into bite-size bits. The Independent http://www.independent.co.uk/news/world/asia/beijing-smog-red-alert-issued-schools-and-businesses-to-completely-shut-down-as-chinese-capital-a6763286.html#gallery
LONDON CYCLING RED ALERT BEIJING Page Title Here With Leading Capitals Like This: Page content here like this. Fixed width as shown here if possible. Depth varies depending on content. Footer varies to maintain page interest and accommodate varying content. You ideally don’t want too much text per page, so break up content into bite-size bits.
Napier 2005 Page Title Here With Leading Capitals Like This: Page content here like this. Fixed width as shown here if possible. Depth varies depending on content. Footer varies to maintain page interest and accommodate varying content. You ideally don’t want too much text per page, so break up content into bite-size bits.
Napier and Hastings 2005 Page Title Here With Leading Capitals Like This: Page content here like this. Fixed width as shown here if possible. Depth varies depending on content. Footer varies to maintain page interest and accommodate varying content. You ideally don’t want too much text per page, so break up content into bite-size bits.
Fine particulate matter (PM) is Hawke’s Bay’s biggest problem…
Fine particulates and health http://www.airbetter.org/effects-air-pollution-human-health/
Heart disease… Page content here like this. Fixed width as shown here if possible. Depth varies depending on content. Footer varies to maintain page interest and accommodate varying content. You ideally don’t want too much text per page, so break up content into bite-size bits. http://www.nanotech-now.com/news.cgi?story_id=27536
NZ Studies Christchurch study – a 3-4% rise in respiratory admissions and 1-2% rise in cardiac admissions with every 15 µg/m 3 increase in PM 10 . • McGowan et al, 2001, Australian and NZ Journal of Public Health NZ Census mortality study - the odds of all-cause mortality in adults increased by 7% per 10 µg/m 3 increase in average PM 10 exposure and 20% per 10 µg/m 3 among Maori. Associations were stronger for respiratory and lung cancer deaths. • Hales S, Blakely T, Woodward A. J Epidemiol Community Health (2010). HAPINZ - the estimated impacts on the population of Hawke’s Bay (2006 data) are more than 100,000 restricted activity days, 54 hospital admissions, 113 premature adult deaths and social costs of $411 million • Updated Health and Air Pollution in New Zealand Study, Kuschel et al., 2012.
Hawke’s Bay Airsheds & Continuous PM 10/2.5 monitoring sites Five airsheds 1. Napier (mainly residential) 2. Hastings (mainly residential) 3. Awatoto (industrial/rural) 4. Whirinaki (industrial/residential) 5. Rest of region
Annual exceedances of the National Environmental Standard (NES) for PM 10 Contaminant Standard Time Average Allowable exceedances per year 10 mgm -3 Carbon monoxide 8 hours 1 200 µgm -3 Nitrogen dioxide 1 hour 9 150 µgm -3 Ozone 1 hour 0 50 µgm -3 PM 10 24 hours 1 350 µgm -3 Sulphur dioxide 1 hour 9 570 ugm -3 1 hour 0 Hastings Napier 30 28 25 20 18 16 15 15 13 12 12 10 10 5 5 5 5 4 4 5 3 3 1 1 0 0 0 2006 2007 2008 2009 2010 2011 2012 2013 2014 2015
PM 10 – a winter problem in residential airsheds HASTINGS
Typical residential (Hastings) winter hourly PM 10 profile
Meteorological influences on exceedances - Napier daily PM 10 versus wind speed and temperature. A characteristic day for an exceedance is when mean wind speed is less than 5 kmh -1 and mean temperature is less than 11 ° C.
Emission Inventory 2015 – estimated sources of PM 10 & other contaminants (Napier winter) PM 10
Source Apportionment 2010 – measured sources of PM 10 & PM 2.5 (Napier) PM 10
Airshed PM 10 modelling 2012 – compared to a temporary network of PM 10 monitors (2014)
Mobile PM 10 monitoring Mobile PM 10 monitoring – identifying hotspots The concentrations shown are instantaneous measurements taken at 1 minute intervals using a Dustrak (on the evening of 23 rd June 2014).
Clean air is considered to be a basic requirement of human health and well-being. However, air pollution continues to pose a significant threat to health worldwide (World Health Organisation, 2005) Outdoor air pollution is a leading environmental cause of cancer deaths (World Health Organisation, 2013) http://www.who.int/phe/health_topics/outdoorair/outdoorair_aqg/en/ http://www.euro.who.int/en/health-topics/environment-and-health/urban-health/news/news/2013/10/outdoor-air-pollution-a-leading- environmental-cause-of-cancer-deaths
Recommend
More recommend