
SLIDE 1
Advancing Solutions to Support More Sustainable Ports Tuesday, - - PowerPoint PPT Presentation
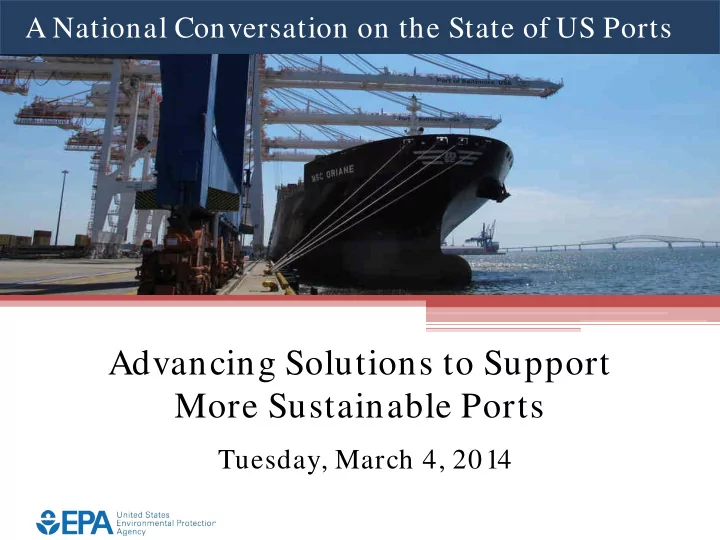
A National Conversation on the State of US Ports Advancing Solutions to Support More Sustainable Ports Tuesday, March 4, 2014 Webinar Agenda Webinar Form at and Housekeeping Welcom e & Opening Rem arks Building a Toolkit for
EPA National Conversation on the State of US Ports
EPA National Conversation on the State of US Ports
Welcom e & Opening Rem arks: Dennis McLerran Regional Administrator U.S. Environmental Protection Agency Region 10
Heather L. Wood, Vice President Government Affairs Virginia Port Authority
EPA National Conversation on the State of US Ports
Advancing Solutions to Support More Sustainable Ports
Vice President , Government Affairs Virginia Port Authority
6
NNMT NIT PMT APMT
7
Figure 2-1: Hampton Roads Ozone Attainment/Maintenance Area (Shown in Green)
8
9
10
11
12
13
14
Elena Craft, Phd, Health Scientist Environmental Defense Fund
EPA National Conversation on the State of US Ports
Health Scientist March 4, 2014
Data Source: Port Authority of Hamburg
per year
Model Year LA/LB CARB SEA/TAC OAKLAND NY/NJ HOUSTON ADOPTED NOV 2007 DEC 2008 APRIL 2009 JUNE 2009 MAR 2010 JAN 2011 PRE-1994 BANNED JAN 2010 BANNED JAN 2010 BANNED JAN 2011 BANNED JAN 2010 BANNED JAN 2011 10% REDUCTION BY 2014 1994-2003 RETROFIT BY JAN 2010 BANNED JAN 2012 RETROFIT BY JAN 2010 BANNED JAN 2014 BANNED JAN 2018 RETROFIT BY JAN 2010 BANNED JAN 2014 BANNED JAN 2017
BANNED JAN 2012 RETROFIT BY JAN 2012 BANNED JAN 2014 BANNED JAN 2018 RETROFIT BY JAN 2012 BANNED JAN 2014 BANNED JAN 2017
REQUIRED JAN 2012 REQUIRED JAN 2014 REQUIRED JAN 2018 REQUIRED JAN 2014 REQUIRED JAN 2017 RECCOMEN- DED BY 2021
stakeholder outreach
recognition levels
promotion and marketing
strengths of potential administrators.
Rose Siengsubcharti, Program Manager San Pedro Bay Port’s Clean Air Action Plan (CAAP) Technology Advancement Program (TAP) Port of Long Beach
EPA National Conversation on the State of US Ports
Environmental Specialist EPA Port Stakeholder Webinar March 2014
SHIPS 54% HARBOR CRAFT 11% CARGO HANDLING EQUIPMENT 10% TRAINS 10% TRUCKS 16% SHIPS 52% HARBOR CRAFT 16% CARGO HANDLING EQUIPMENT 9% TRAINS 15% TRUCKS 7%
DEMONSTRATION PROJECT SOURCE CATEGORY TOTAL PROJECT COST TAP FUNDING AGENCY FUNDING SEAWATER SCRUBBER SHIPS $3,390,000.00 $1,650,000.00 NA FUEL SLIDE VALVE SHIPS $1,300,000.00 $45,000.00 $783,628.00 DIESEL PARTICULATE FILTER TRAINS $692,356.00 $150,000.00 $346,178.00 SOCK ON A STACK SHIPS $603,211.00 $299,054.00 $55,000.00 DIESEL PARTICULATE FILTER HARBOR CRAFT $531,308.00 $265,654.00 NA DIESEL PARTICULATE FILTER CARGO HANDLING EQUIPMENT (CRANE) $322,140.00 $64,668.42 NA FUEL SLIDE VALVE (FOLLOW-UP) SHIPS PORTS PROJECT $216,000.00 NA
DEMONSTRATION PROJECT SOURCE CATEGORY TOTAL PROJECT COST TAP FUNDING AGENCY FUNDING LNG ENGINE CERTIFICATION TRUCKS $9,894,027.00 $500,000.00 $1,750,000.00 LNG YARD TRACTOR CARGO HANDLING EQUIPMENT (YARD TRACTOR) $425,000.00 $350,000.00 $75,000.00 CNG TRUCK TRUCKS IN-KIND $223,155.00 $421,250.00 EMULSIFIED BIODIESEL FUEL CARGO HANDLING EQIUPMENT (TOP HANDLERS) $132,000.00 $88,000.00 NA
DEMONSTRATION PROJECT SOURCE CATEGORY TOTAL PROJECT COST TAP FUNDING AGENCY FUNDING HYBRID TUGBOAT HARBOR CRAFT $8,000,000.00 $1,389,920 NA HYBRID YARD TRACTOR CARGO HANDLING EQUIPMENT (YARD TRACTOR) $1,200,00.00 $600,00.00 $300,000.00 HYBRID CRANE CARGO HANDLING EQUIPMENT (RTG CRANE) $169,870.00 $84,935.00 $130,130.00 PLUG-IN HYBRID YARD TRACTOR CARGO HANDLING EQUIPMENT (YARD TRACTOR) IN-KIND $61,500 NA ENERGY STORAGE CARGO HANDLING EQUIPMENT (RTG CRANE) PORTS PROJECT $23,000.00 $8,000.00 HYBRID YARD TRACTOR (FOLLOW-UP) CARGO HANDLING EQUIPMENT (YARD TRACTOR) PORTS PROJECT $26,000.00 NA
DEMONSTRATION PROJECT SOURCE CATEGORY TOTAL PROJECT COST TAP FUNDING AGENCY FUNDING ALL-ELECTRIC YARD TRACTOR (LEAD ACID BATTERIES) CARGO HANDLING EQUIPMENT (YARD TRACTOR) PORT PROJECT $263,500.00 $263,500.00 ALL-ELECTRIC YARD TRACTOR (LITHIUM ION BATTERIES CARGO HANDLING EQUIPMENT (YARD TRACTOR) $940,000.00 $400,000.00 NA ALL-ELECTRIC ON-ROAD TRUCKS (NEW) TRUCKS $4,429,421.00 $300,000.00 $3,488,801.00
Rose Siengsubcharti POLB TAP Coordinator rose.sieng@polb.com Renee Moilanen Zero Emissions Coordinator renee.moilanen@polb.com Teresa Pisano POLA TAP Coordinator tpisano@portla.org Tim DeMoss Zero Emissions Coordinator tdemoss@portla.org
Beth Carper Air Resources Specialist Puget Sound Clean Air Agency
EPA National Conversation on the State of US Ports
Stephanie Jones-Stebbins, Director Seaport Environmental and Planning Programs Port of Seattle
Stephanie Jones Stebbins, Port of Seattle Beth Carper, Puget Sound Clean Air Agency
– Ocean-going vessels (OGV) – Harbor vessels – Rail – Cargo handling equipment (CHE) – Trucks – Port administration
Targeted Emissions 2015 Goals 2020 Goals Measurement
Diesel particulate matter 75% reduction 80% reduction Emissions per ton of cargo Greenhouse gases 10% reduction 15% reduction Emissions per ton of cargo
Actions 2015 Targets 2020 Targets Reduces
DPM GHG
Vessels surpass Emission Control Area (ECA) requirements Early compliance with 2015 ECA 0.1% fuel-sulfur level
(or equivalent) while hoteling before Jan 1, 2015
Ports track number of vessels improvements
(Tier 3 marine engines, cleaner fuel, shorepower, & other emission-reduction technologies)
Ports & carriers join port-designed or 3rd-party certification programs promoting continuous improvement Ports and 10% of vessel calls Ports and 40% of vessel calls
Actions 2015 Targets 2020 Targets Reduces
DPM GHG
Strategy Partners (S.P) conduct annual outreach
to port-related harbor vessel companies &
recognize best practices and engine upgrades S.P. conduct outreach & 50% of harbor vessel companies report
best practices and engine upgrades
S.P. conduct outreach & 90% of harbor vessel companies report
best practices and engine upgrades
Ports & harbor vessels join
port-designed or 3rd-party certification
programs that promote continuous improvement Ports and 10% of harbor vessels Ports and 40% of harbor vessels
– Most common and successful projects – Expensive – Require grants unless existing engine fails
– Competitive bid process – Scrapping old engines
Actions 2015 Targets 2020 Targets Reduces
DPM GHG
Switcher locomotive
participate in a fuel- efficiency program 100% owners/operators institute a program 100% owners/operators achieve performance
program
Switcher locomotive
replace unregulated engines
(engine replacements Tier2 or better)
10% of unregulated locomotive engines 20% of unregulated locomotive engines
– Like harbor vessels, most successful projects and most expensive. – Stronger resistance to projects, with or without grants
– Installed on most locomotives in our region (on new engines
– Some grants covered 50 to 100% of initial costs – Incredible fuel savings—rail companies miss out if they don’t invest in it
Actions 2015 Targets 2020 Targets Reduces
DPM GHG
CHE meets Tier 4 interim (T4i) emission standards
50% of equipment 80% of equipment Ports & terminals have fuel-efficiency plans in place that promote continuous improvement Ports and 50% of terminals Ports and 100% of terminals
– Pre- and post-installation training improves chance of success – Require significant follow up support – Work well if terminal is invested in proactively maintaining their equipment
– If programmed correctly, provide fuel savings and warm starts with fewer emissions – Co-benefits include: better battery life and fewer maintenance issues
Actions 2015 Targets 2020 Targets Reduces
DPM GHG
Trucks meet or surpass EPA emission standards for model year 2007 100% of trucks by the end of 2017 Ports, terminals, and trucks have fuel-efficiency plans in place that promote continuous improvement Ports Ports, terminals, and 50% of trucks
– Owner/operators don’t have significant capital to buy replacements – Programs require significant administrative resources – Funding sources to-date have included Ports, state environmental agencies, and CMAQ; DERA also an option
Actions 2015 Targets 2020 Targets Reduces
DPM GHG
Ports own and operate cleaner vehicles/ equipment & have fuel-use reduction plans promoting continuous improvement Ports report use of cleaner vehicles and equipment and other relevant information Ports increase use of cleaner vehicles and equipment Ports apply clean construction standards to engines used on port-led construction projects Ports adopt clean construction practices for port-led projects, & enact a plan for Tier 2 engine emission reqts. Ports continue to apply clean construct. practices for port-led projects, & enact a plan for Tier 4 engine emission reqts. Ports facilitate energy studies and conservation projects at port-owned and/or tenant facilities Each port conducts 3 energy studies Each port completes 3 energy conservation projects
– Getting three ports to agree on goals is challenging, but unifying once accomplished – Successful collaboration lays a foundation for more ambitious goals – International port collaboration is even more difficult due to differing regulatory structures
– Sometimes the largest-emitting sector isn’t the one to which the public, and thus leaders, pay the most attention – Incentivizing voluntary actions usually takes money; having a multi- port strategy helps with grant applications and helps leaders commit funds
JonesStebbins.S@portseattle.org
bethc@pscleanair.org
Reade Kidd, Director International Logistics The Home Depot
EPA National Conversation on the State of US Ports
If you would like to verbally ask a question or comment during the Q&A session, click the raised hand
phone line and announce your name when it is your turn to speak. *Please make sure your phone is unmuted on your end. You may also submit a question by typing into the Enter a question for staff box and click the Send button. Staff will read and answer these questions as time allows.
EPA National Conversation on the State of US Ports
Please join us— Na tiona l Port Sta kehold ers Sum m it Hilton Baltim ore Baltim ore, Maryland Tuesday, April 8 , 20 14 Hosted by the EPA’s Office of Transportation and Air Quality, this Summit will bring together leaders from industry, government, community groups, and others with a shared interest in promoting healthy air at and around ports. The goal is to advance strategies that support more sustainable ports while encouraging economic growth.
Find out how to register for the National Summit and about EPA’s Ports Initiative at: www.epa.gov/ otaq/ ports Please contact us at talkaboutports@epa.gov to ask a question or to submit a comment
EPA National Conversation on the State of US Ports