
SLIDE 1
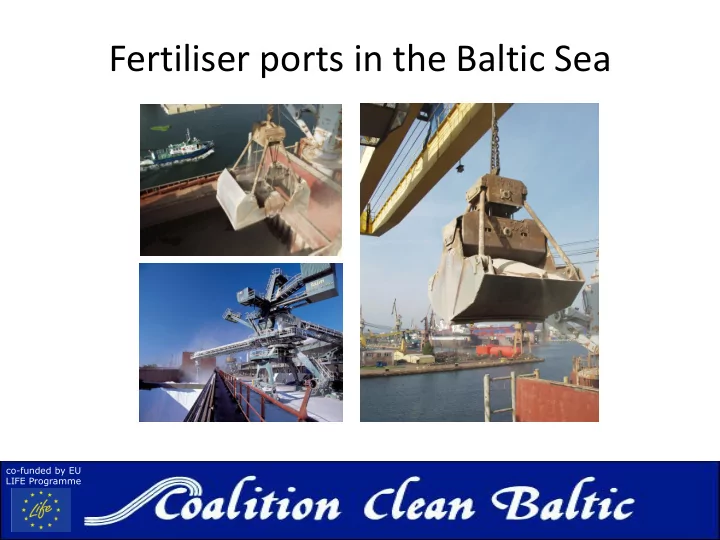
Fertiliser ports in the Baltic Sea
co-funded by EU LIFE Programme
Fertiliser ports in the Baltic Sea co-funded by EU LIFE Programme - - PowerPoint PPT Presentation
Fertiliser ports in the Baltic Sea co-funded by EU LIFE Programme Fertiliser ports in the Baltic Sea Over 70 ports 33 million tons 10 largest ports: Klaipeda, St Petersburg, Gdansk, Gdynia, Szczecin Swinoujscie, Port of
co-funded by EU LIFE Programme
The map of the Baltic ports handling fertilizers was compiled in Google Maps and is available at https://goo.gl/COmDYa
co-funded by EU LIFE Programme
744 000 1 972 000 2 310 000 2 309 000 3 081 000 8 574 000 6 768 000 7 302 000 255 000
Denmark Estonia Finland Germany Latvia Lithuania Poland Russia Sweden
8 574 000 6 023 000 1 940 000 1 873 000 1 700 000 1 642 000 1 633 000 1 566 000 1 527 000 1 414 000 1 255 000 1 074 000
Klaipeda St Petersburg Gdansk Gdynia Szczecin – Swinoujscie Port of Tallinn Muuga (Tallinn) Ventspils Rostock Riga Police HaminaKotka Uusikaupunki Vyborg Ust-Luga Lübeck Kokkola Sillamäe Kolding Kaliningrad Wismar Randers Lidköping Siilinjärvi Korsoer Vierow Stralsund Liepaja Flensburg Aarhus Skulte Bekker Kristinehamn Greifswald, Landkreis Kalundborg Aalborg Kaskinen Aabenraa
80 268 000 42 908 000 106 070 000 51 959 000 70 480 000 42 385 000 64 282 000 216 034 000 161 580 000
Denmark Estonia Finland Germany Latvia Lithuania Poland Russia Sweden
Kolding
Port Amount, t Port Amount, t Port Amount, t Kolding 222 000 Koege 19 000 Vejle 8000 Randers 175 000 Grenaa 19 000 Nakskov 7000 Korsoer 85 000 Hundested 17 000 Odense 7000 Aarhus 47 000 Holbaek 17 000 Guldborgsund 5000 Kalundborg 32 000 Roedby 10 000 Fredericia 4000 Aalborg 25 000 Horsens 10 000 Svendborg 2000 Aabenraa 23 000 Roenne 8000 Hobro 2000
co-funded by EU LIFE Programme
Tallinn, Muuga; Sillamäe
Port Amount, t Remark Tallinn 1 642 000 Fertilisers are handled at harbours of Muuga (1 633 000 t) and Pajassaare (9000 t) Sillamäe 283 000 Another source report 1,18 mln tons mineral fertilizers in 2013 (As no statistics on fertilizer transshipment are available for the Port of Sillamäe, the cargo turnover has been estimated on port bound railway shipments) Bekker 44 000 Vene-Balti 3 000
co-funded by EU LIFE Programme
HaminaKotka
Port Amount, t Remark Port Amount, t HaminaKotka 1 074 000 Muusalo harbour is specializing particularily in the transshipment of fertilizers, with the Dry Bulk and Liquid terminals. Pietarsaari 6 000 Uusikaupunki 772 000 Pori 3 000 Kokkola 283 000 (Silverstone port) Tolkkinen 2 000 Siilinjärvi 129 000 (inland lake port) Helsinki 1 000 Kaskinen 23 000 Kemiö 1 000 Vaasa 16 000
co-funded by EU LIFE Programme
Rostock
Port Amount, t Remark Rostock 1 527 000 In 2010 - 829 000 ton; The fertlizer quay is operated by Euroports Düngemittel Dienstleistung Rostock GmbH and is equipped with a ship loader with a capacity of 600 tons/hour, wagon unloading station, conveyor and belt system. There are two special fertilizer sheds with a storage capacity of 60,000 tons. The fertilizer export facilities are storing about 550 000 tons yearly. Lübeck 316 000 in 2010 419 000 ton Wismar 201 000 in 2010 165 000 ton Vierow 84 000 Stralsund 57 000 in 2010 - 36 000 ton Flensburg 56 000 in 2010 72 000 ton Greifswald, Landkreis 33 000 Wolgast 20 000 in 2010 - 18 000 ton Berndshof 9000 Neustad / Holstein 2000 Burgstaaken 2000 Heiligenhafen 2000 Kiel 0 (but had volumes in 2012. In 2010 17 000 ton Rendsburg(in Kiel canal) 0 but had volumes in 2012. in 2010 64 000 ton Sassnitz 0 in 2010 2000 ton Lubmin 0 in 2010 30 000 ton
co-funded by EU LIFE Programme
Ventspils, Riga, Liepaja
Port Amount, t Remark Skulte 45 000 Riga 1414000 Riga Fertilizer Terminal and Alpha Osta terminal Ventspils 1566000 Liepaja 56 000
co-funded by EU LIFE Programme
Klaipeda
Port Amount, t Remark Dry fertilisers Liquid fertilisers bulk packed Klaipeda 8 574 000 The port has 3 bulk fertilizer terminals, and 2 liquid fertilizer terminals 6 900 000 410 000 1 270 000
co-funded by EU LIFE Programme
Gdansk, Police
Port Amount, t* Remark Gdansk 1 940 000
Chemikow quay : handling (cap. 400 t/hr) and storage terminal (75 000 tonnes) in cooperation with Gdansk Phosphate Fertilizer Plant ”Fosfory”, for inorganic fertilizers, phosphate raw materilas
Przemyslowe quay: inorganic fertilizers, handling capacity 400 t/hr; capacity for liquid cargos, as liquid fertilizers, with 300 t/hr
Wislane quay: handle and package dry chemical fertilizers
Gorniczy basin: railcar unloader for fertilizers Gdynia 1 287 300 Baltic Bulk terminal (BBT) exports Polish chemical products, primarliy fertilizers. e.g. handle Polish ammonium sulphate and other fertilizer imports and exports. BBT liquid products terminal (capacity 400 m³/hr) handle exports of ammonium nitrate Szczecin – Swinoujscie 1 700 000
Major dry bulk cargo types transshipped and stored incl.
Police (in Szczecin lagoon) 1 255 000
Bargin terminal, Southern Wharf – load the products of fertlizers (conveyor capacity 3500 tons/day)
Miljanka teminal, for liquid products handling, e.g. ammonia
co-funded by EU LIFE Programme
St.Petersburg, Ust-Luga, Kaliningrad
Port Amount, t Remark Vyborg 579 000 St Petersburg 6 023 000 Big Port-St Petersburg, Baltic Bulk Terminal Ust-Luga 493 000 Ust-Luga port is strongly expanding fertilisers transshipment since 2012. EuroChem was planning to launch in 2014 new Mineral fertilizers terminal for a target capacity of 5 -6 mln tons annually2. The European Sulphur Terminal has also handled fertilizers. Kaliningrad 207 000 is the only Russian port capable of handling liquid fertilizers2, but the liquid freight flow remains on a stable, but low level; 82 000 – liquid bulk (2013)
co-funded by EU LIFE Programme
Lidköping
Port Amount, t Remark Port Amount, t Lidköping 134 000 lake Vänern Mönsterås 8000 Kristinehamn 40 000 lake Vänern Skellefteå 5000 Kalmar 19 000 Söråker 3000 Klintehamn 16 000 Bergkvara 3000 Luleå 12 000 Trelleborg 3000 Umeå 10 000 Visby 2000
co-funded by EU LIFE Programme