
SLIDE 1
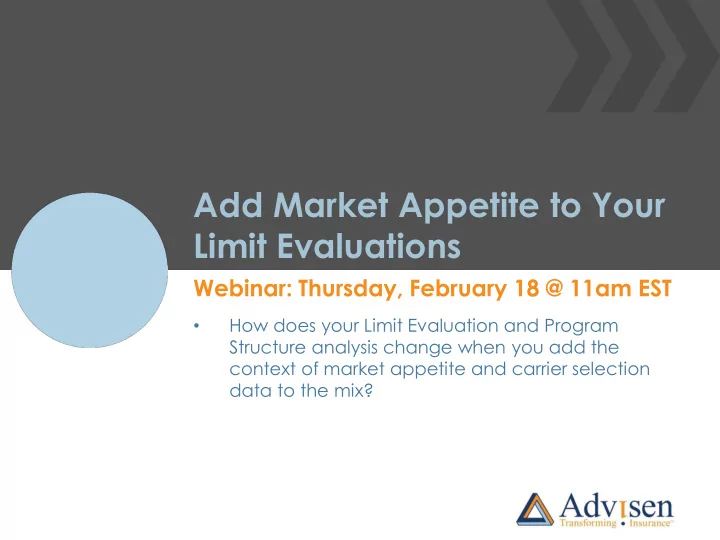
Add Market Appetite to Your Limit Evaluations
Webinar: Thursday, February 18 @ 11am EST
- How does your Limit Evaluation and Program
Add Market Appetite to Your Limit Evaluations Webinar: Thursday, - - PowerPoint PPT Presentation
Add Market Appetite to Your Limit Evaluations Webinar: Thursday, February 18 @ 11am EST How does your Limit Evaluation and Program Structure analysis change when you add the context of market appetite and carrier selection data to the
Daniel Hobbs
Director of Product Management
Jeffrey M. Cohen
Executive Vice President, Global Business Development
2
3
3.3M insurance programs $200B in premium 665K insureds Our free, 10-page Insurance Program Benchmarking methodology document shows how we track and match this transaction data. 312,000 events $7 trillion in loss value 160K insureds Our free, 8-page MSCAd Methodology report describes how we collect and curate loss event data.
4
5
6
7
8
9
About Advisen Ltd. Advisen is leading the way to smarter and more efficient risk and insurance communities. Through its information, analytics, ACORD messaging gateway, news, research, and events, Advisen reaches more than 150,000 commercial insurance and risk professionals at 8,000 organizations worldwide. The company was founded in 2000 and is headquartered in New York City, with offices in the US and the UK. +1 (212) 897-4800 | info@advisen.com | www.advisenltd.com
Download our free, 10-page Insurance Program Benchmarking methodology document shows how we track and match this transaction data.
DID YOU KNOW? In June 2014, Advisen received US Patent 8762178 B2 for a benchmarking “system and method for providing global information on risks and related hedging strategies.”
12
all industries and LOBs
Download our free, 8-page
that describes how we collect and curate loss event data.
13
14
15
NEW!