
SLIDE 1
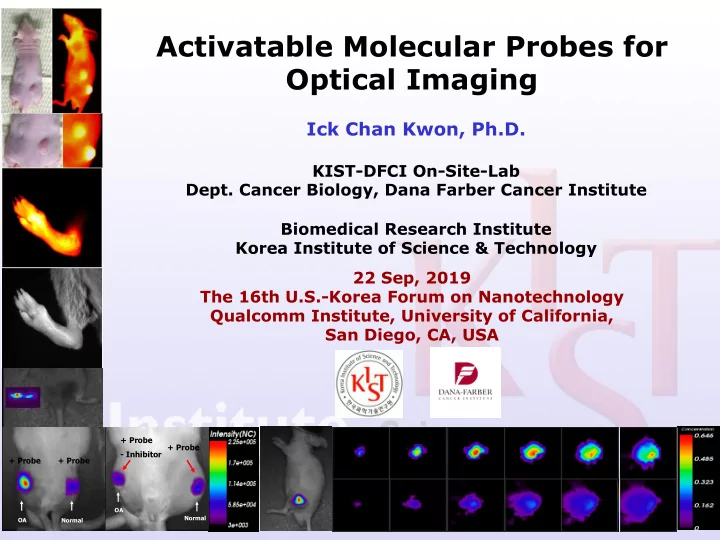
Ick Chan Kwon, Ph.D.
KIST-DFCI On-Site-Lab
- Dept. Cancer Biology, Dana Farber Cancer Institute
Biomedical Research Institute Korea Institute of Science & Technology
OA Normal
+ Probe
- Inhibitor
OA Normal
+ Probe + Probe + Probe
OA Normal
+ Probe
- Inhibitor
OA Normal
+ Probe + Probe + Probe
Activatable Molecular Probes for Optical Imaging
22 Sep, 2019 The 16th U.S.-Korea Forum on Nanotechnology Qualcomm Institute, University of California, San Diego, CA, USA