
SLIDE 1
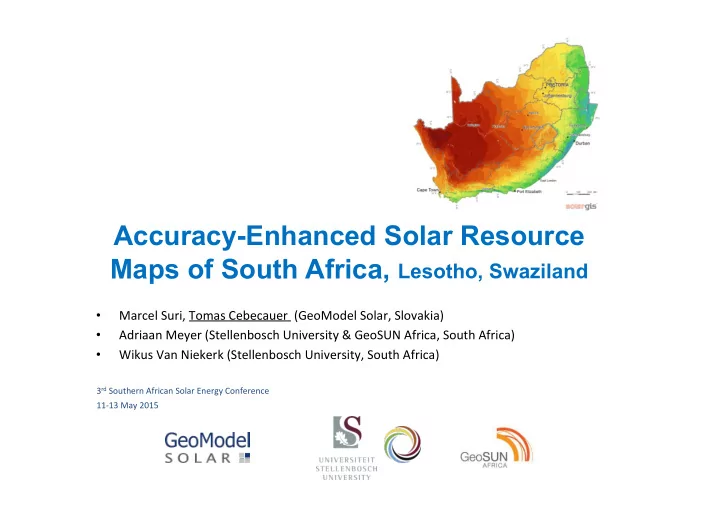
Accuracy-Enhanced Solar Resource Maps of South Africa, Lesotho, Swaziland
- Marcel ¡Suri, ¡Tomas ¡Cebecauer ¡ ¡(GeoModel ¡Solar, ¡Slovakia) ¡
- Adriaan ¡Meyer ¡(Stellenbosch ¡University ¡& ¡GeoSUN ¡Africa, ¡South ¡Africa) ¡
- Wikus ¡Van ¡Niekerk ¡(Stellenbosch ¡University, ¡South ¡Africa) ¡
3rd ¡Southern ¡African ¡Solar ¡Energy ¡Conference ¡ 11-‑13 ¡May ¡2015 ¡