
SLIDE 1
Confidential Confidential
MPI Corporation (6223.TT) MPI Corporation (6223.TT)
Morgan Stanley Morgan Stanley
1 2
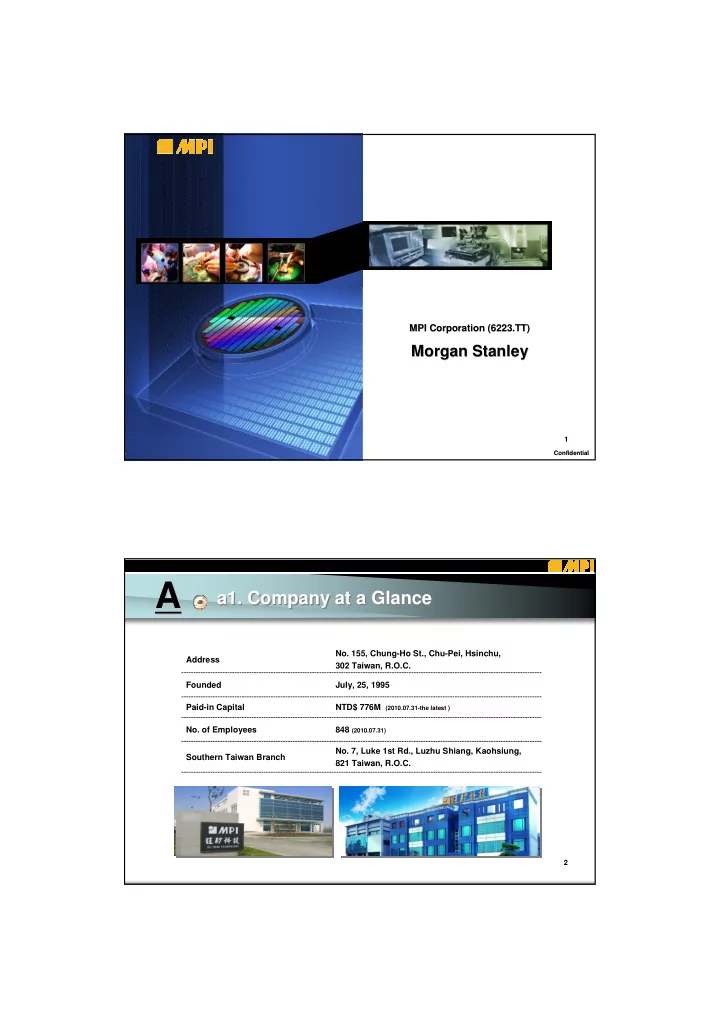
- a1. Company at a Glance
- a1. Company at a Glance
A A
Address
- No. 155, Chung-Ho St., Chu-Pei, Hsinchu,
302 Taiwan, R.O.C. Founded July, 25, 1995 Paid-in Capital NTD$ 776M (2010.07.31-the latest )
- No. of Employees
848 (2010.07.31) Southern Taiwan Branch
- No. 7, Luke 1st Rd., Luzhu Shiang, Kaohsiung,
821 Taiwan, R.O.C.