9/27/2017 Disclosure Selecting Progestogens: Breast, Advisory - - PDF document

9 27 2017
SMART_READER_LITE
LIVE PREVIEW

9/27/2017 Disclosure Selecting Progestogens: Breast, Advisory - - PDF document

9/27/2017 Disclosure Selecting Progestogens: Breast, Advisory Consulting Allergan Cardiovascular, and Cognitive Outcomes Therapeutics MD Pfizer Bayer James H Liu, MD Clinical Trials for the University Hospitals


slide-1
SLIDE 1

9/27/2017 1

Selecting Progestogens: Breast, Cardiovascular, and Cognitive Outcomes James H Liu, MD

Arthur H Bill Professor and Chair Departments of Reproductive Biology and Obstetrics and Gynecology UH Cleveland Medical Center

9/27/2017 2

Disclosure

  • Advisory‐Consulting

– Allergan – Therapeutics MD – Pfizer – Bayer

  • Clinical Trials for the University Hospitals

– Allergan – AbbVie – NIH‐ Contraceptive Trials Network – Palatin

3

  • 1. Focus on progestins in clinical use
  • Progesterone (P4)
  • Medroxyprogesterone acetate (MPA)
  • Norethindrone (Norethisterone, NET)
  • 2. Biology, metabolism, structure‐functional

relationships

  • 3. Caveat: All studies discussed will reflect the effects
  • f combination of estrogen (E2, CEE) with different

progestin exposures.

Overview

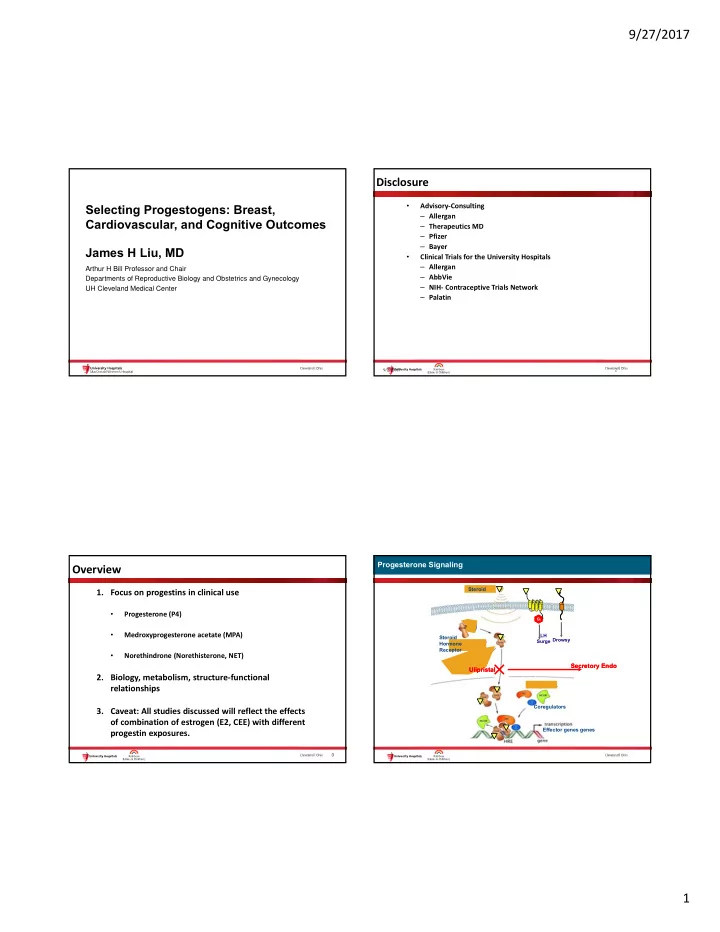
Progesterone Signaling Progesterone Signaling

Coregulators Effector genes genes

Gi Gi

LH Surge Drowsy Steroid Steroid Hormone Receptor

Ulipristal Ulipristal Secretory Endo Secretory Endo

slide-2
SLIDE 2

9/27/2017 2

Progestins: Related But Distinct Agents

Progesterone

Deletion of the methyl group between rings A and B

Addition of an ethinyl group at position 17 Medroxyprogesterone acetate

Structural Differences Among Progestins

C= O O CH3 C= O O CH3 CH3 OCCH3 O

Norethindrone acetate

O C= CH O OCCH3

Bailey D G , Dresser G K CMAJ 2004;170:1531-1532

Oral Progesterone Intake and the First Pass Effect

Oral progesterone metabolites i.e. 20-DHP4 results in drowsiness

3HP 20DHP Brain Sedation Progesterone 5P Breast

O OH O O H O O 5-reductase HO O

Oral Progesterone Metabolism: Off Target Effects

Medroxyprogesterone acetate Metabolism

MPA template structure is not broken by CYP3A4 during metabolism and binds as MP-acetate to progesterone receptors

Zhang Drug Metabolism and Dispostion 2008;2292

slide-3
SLIDE 3

9/27/2017 3

ENDOMETRIUM

On Target Effects

9

Minimal Dose of MPA Required for Endometrial Protection On Target Effects

Gibbons WE et al. Am J Obstet Gynecol. 1986;154:456-461. 0.3 mg CEE 0.625 mg CEE 1.25 mg CEE 200 100 y=0.99 B CEE

  • nly

* +2.5 MPA +5 MPA +10 MPA 0.625 mg CEE† 200 100 FM/mgP ±SEM Femtamoles/mg protein ±SEM D Cytosolic Estrogen Receptor CEE = conjugated equine estrogen; MPA = medroxyprogesterone acetate.

Suggested Progestin Doses Required For Secretory Changes in E-Primed Endometrium for 10-12 days

Oral Progestin Medroxyprogesterone acetate Micronized progesterone Vaginal progesterone gel Drospirenone Norethindrone Norgestrel Dydrogesterone Dose Required 5-10 mg/d 200-300 mg/d 45 mg/d* 0.25-1 mg/d* 0.35-1.0 mg/d 75-150 g/d 10-20 mg/d King et al. Fertil Steril 1986;46(6):1062; Whitehead et al. Obstet Gynecol 1990;75(4):59S; * Other data

How Much Progestin is Sufficient?

A Simple Method for Determining the Optimal Dosage of Progestin in Post‐menopausal Women Receiving Estrogens Padwick ML, Pryse‐

Davies J, Whitehead MI. NEJM 1986;315:930‐34

“Regardless of the preparation and dosage of the (cyclic) estrogen and progestin used, wholly

  • r

predominantly proliferative endometrium was always associated with bleeding on or before day 10 after the addition of progestin; wholly or predominantly secretory endometrium, or a lack of endometrial tissue was associated with bleeding on day 11 or later. “

slide-4
SLIDE 4

9/27/2017 4

Biology: Progesterone Effects on Gland Mitoses in Human Breast and Endometrium Are Different

Mitoses

Breast Endometrium

1 7 14 21 28

Cycle Days

T.A. Longacre et al. Am J. Surg Path, Vol.10 No. 6, 1986

On Target Effects Off Target Effects

BREAST

Off Target Effects

14

WHI CEE+MPA Trial: Mammography Results Increased Breast Density, Cysts

*Abnormal mammograms included those that were associated with recommendations for short-term follow-up, showed a suspicious abnormality, or were highly suggestive of malignancy

†P < .001 vs E+P.

Chlebowski RT, et al. JAMA. 2003;289:3243-53.

% Abnormal* E+MPA Placebo Year 1 Overall 9.4 31.5 5.4† 21.2† WHI CEE+MPA: During Study and Follow-up Breast Cancer

16 9/27/2017

Modified from Heiss et al. JAMA 2008;299:1036-45

Proportion

slide-5
SLIDE 5

9/27/2017 5

0.00 0.01 0.02 0.03 0.04 0.05 1 2 3 4 5 6 7 8

Time (years) Cumulative Proportion

CEE Placebo

Women’s Health Initiative Steering Committee. JAMA. 2004;291:1701-12.

Kaplan-Meier Estimate

HR = 0.77 95% nCI = 0.59–1.01

No Increased Risk of Invasive Breast Cancer in the WHI CEE-Alone Trial WHI CEE+MPA Trial: Characteristics of Invasive Breast Cancers

E+P (n = 199) Placebo (n = 150) P-Value Tumor size, mean ± SD (cm) 1.7 ± 1.1 1.5 ± 0.9 .04 Positive lymph nodes, % 25.9 15.8 .03 SEER stage, % Localized 74.6 82.7 Regional 24.4 14.0 .048 Metastatic 1.0 2.0 Morphology, grade, % Well differentiated 25.0 20.3 Moderately differentiated 43.3 47.7 .61 Poorly differentiated/anaplastic 31.7 32.0

SEER = Surveillance, Epidemiology, and End Results. Chlebowski RT, et al. JAMA. 2003;289:3243-53.

Summary: WHI Breast Cancer Results

– CEE alone used for an average of 7 yrs did not increase breast cancer risk in women with prior hysterectomy1 – CEE+MPA used for an average of 5 yrs was associated with a small increased risk of breast cancer in women without prior hysterectomy2

  • Increased risk was limited to those women with prior

HT use – Absolute risk of breast cancer was low in both WHI trials, regardless of treatment assignment1,2

1Women's Health Initiative Steering Committee. JAMA. 2004;291:1701-12. 2Chlebowski RT, et al. JAMA. 2003;289:3243-53.

Summary: WHI Breast Cancer Results

– Breast cancers among women assigned to CEE+MPA were somewhat larger and more likely to involve regional lymph nodes – Higher rate of abnormal mammograms

  • bserved in women assigned to CEE+MPA

– Cannot make direct comparisons between the CEE‐ alone and CEE+MPA results

  • Study populations had important differences in

baseline risk

Chlebowski RT, et al. JAMA. 2003;289:3243-53.

slide-6
SLIDE 6

9/27/2017 6

Breast Cancer Risk Among CEE+MPA Users in Randomized Controlled Trials

Chlebowski RT, et al. JAMA. 2003;289:3243-53. Hulley S, et al. JAMA. 2002;288:58-66.

WHI HERS HERS II

Relative Hazard (95% CI)

0.5 1.0 10 2.0

Million Women Study

– Investigators recruited 1,084,110 women in the UK, aged 50–64 years, between 1996 and 2001 – Questionnaire about lifestyle, SES, medical history, and HT use sent in conjunction with invitation from NHSBSP for screening mammography – Mean age, 56 years; 9364 cases of invasive breast cancer and 637 breast cancer deaths identified during follow-up – Analysis of HT and breast cancer risk restricted to postmenopausal women (n = 828,923) – 50% were ever-users of HT; 33% were current users; mean duration of use was 5.8 years

SES = socioeconomic status; NHSBSP = National Health Service Breast Screening Programme. Million Women Study Collaborators. Lancet. 2003;362:419-27.

Incident Invasive Breast Cancer in Relation to Recency and Type of HT Used

0.5 1.0 1.5 2.0 2.5

FCI = floated CI. *Relative to never-users, stratified by age, time since menopause, parity and age at first birth, family history of breast cancer, body mass index, region, and deprivation index. Million Women Study Collaborators. Lancet. 2003;362:419-27.

HT Use at Baseline Relative Risk (95% FCI)* All never-users 1.00 (0.96–1.04) All past users 1.01 (0.95–1.08) Current users E-only 1.30 (1.22–1.38) E+P 2.00 (1.91–2.09) Tibolone 1.45 (1.25–1.67) Other/unknown types 1.44 (1.17–1.76)

Incident Invasive Breast Cancer in Current Users of E-only Preparations Type of Estrogen?

0.5 1.0 1.5 2.0

Dotted line represents overall relative risk for current users of estrogen-only preparations compared with never-users at baseline. *Relative to never-users, stratified by age, time since menopause, parity and age at first birth, family history of breast cancer, BMI, region, and deprivation index. Million Women Study Collaborators. Lancet. 2003;362:419-27.

E-only Formulation Relative Risk (95% CI)* All E-only formulations 1.30 (1.21–1.40) By constituent and dose All equine estrogen 1.29 (1.16–1.43) ≤0.625 mg 1.25 (1.11–1.41) >0.625 mg 1.36 (1.14–1.61) All 17-estradiol 1.24 (1.12–1.37) ≤1 mg 1.25 (1.12–1.40) >1 mg 1.19 (0.89–1.58) By formulation Oral 1.32 (1.21–1.45) Transdermal 1.24 (1.11–1.39) Implanted 1.65 (1.26–2.16)

slide-7
SLIDE 7

9/27/2017 7

Incident Invasive Breast Cancer in Relation to Recency and Type of HT Used

0.0 1.0 2.0 3.0 FCI = floated CI. *Relative to never-users, stratified by age, time since menopause, parity and age at first birth, family history of breast cancer, BMI, region, and deprivation index. Million Women Study Collaborators. Lancet. 2003;362:419-27. Total Duration of HT Use by Type

  • f HT Used at Baseline

Relative Risk (95% FCI)* Never-users of HT 1.00 0.96–1.04 Past users of HT <1 year 0.94 (0.84–1.05) 1–4 years 1.01 (0.92–1.12) 5–9 years 1.14 (1.00–1.30) ≥10 years 1.05 (0.84–1.30) Current users of E alone <1 year 0.81 (0.55–1.20) 1–4 years 1.25 (1.10–1.41) 5–9 years 1.32 (1.20–1.46) ≥10 years 1.37 (1.22–1.54) Current users of E+P <1 year 1.45 (1.19–1.78) 1–4 years 1.74 (1.60–1.89) 5–9 years 2.17 (2.03–2.33) ≥10 years 2.31 (2.08–2.56)

Incident Invasive Breast Cancer in Current Users of E+P Preparations Type of Progestin

0.0 1.0 2.0 3.0

Dotted line represents overall relative risk for current users of estrogen-progestin preparations compared with never-users at baseline. *Relative to never-users, stratified by age, time since menopause, parity and age at first birth, family history of breast cancer, BMI, region, and deprivation index. Million Women Study Collaborators. Lancet. 2003;362:419-27.

Duration of Use, <5 Years

E+P Formulation Relative Risk (95% CI)* All E+P formulations 1.70 (1.56–1.86) By progestin constituent Medroxyprogesterone acetate 1.60 (1.33–1.93) Norethisterone 1.53 (1.35–1.75) Norgestrel/levonorgestrel 1.97 (1.74–2.33) By type of regimen Sequential 1.77 (1.59–1.97) Continuous 1.57 (1.37–1.79)

Dotted line represents overall relative risk for current users of estrogen-progestin preparations compared with never-users at baseline. *Relative to never-users, stratified by age, time since menopause, parity and age at first birth, family history of breast cancer, BMI, region, and deprivation index. Million Women Study Collaborators. Lancet. 2003;362:419-27.

Duration of Use, 5 Years

Incident Invasive Breast Cancer in Current Users of E+P Preparations

0.0 1.0 2.0 3.0

E+P Formulation Relative Risk (95% CI)* All E+P formulations 2.21 (2.06–2.36) By progestin constituent Medroxyprogesterone acetate 2.42 (2.10–2.80) Norethisterone 2.10 (1.89–2.34) Norgestrel/levonorgestrel 2.23 (2.04–2.44) By type of regimen Sequential 2.12 (1.95–2.30) Continuous 2.40 (2.15–2.67)

COGNITION

Off Target Effects

28

slide-8
SLIDE 8

9/27/2017 8

Defining Cognition Domains

  • Cognition comprises multiple

mental processes – Attention – Perception – Working memory – Executive function – Spatial ability – Language – Learning – Memory

  • Figural
  • Verbal

Adapted from Loring DW, ed. INS Dictionary of Neuropsychology. New York, NY: Oxford University Press; 1999:39.

Normal Cognitive Aging – Preserved vocabulary –  Memory –  Motor/psychomotor speed –  Attention –  Visuospatial performance –  Visuomotor skills

Ashman TA, et al. In: Hazzard WR, et al, eds. Principles of Geriatric Medicine and Gerontology. New York, NY: McGraw-Hill; 1999;1219-28.

Normal Cognitive Aging Versus Dementia

Everyone with dementia has cognitive impairment, but not everyone with cognitive impairment has dementia

Dementia represents a decline in memory and at least one other cognitive domain1

With dementia, the decline interferes with occupational or social functioning1

1American Psychiatric Association. Diagnostic and Statistical Manual of Mental Disorders. 4th ed. Washington, DC:

American Psychiatric Association; 1994.

1 2 3 4 5 6 7

Years Since Randomization Fitted Mean 3MSE Score

WHIMS: Mean Modified Mini-Mental State Exam (3MSE) Scores Over Time

Adapted from Espeland MA, et al. JAMA. 2004;291:2959-68.

CEE/MPA Trial P = .055 CEE-Alone Trial P = .04 Active Drug Placebo 97 96 95 100

slide-9
SLIDE 9

9/27/2017 9

WHIMS: Probable Dementia

Shumaker SA, et al. JAMA. 2003;289:2651-62. Shumaker SA, et al. JAMA. 2004;291:2947-58.

CEE+MPA (n = 2229) Placebo (n = 2303) HR (95% CI) Cases of probable dementia* 40 21 2.05 (1.21–3.48) Rate per 10,000 person-years 45 22 CEE Alone (n = 1464) Placebo (n = 1483) HR (95% CI) Cases of probable dementia† 28 19 1.49 (0.83–2.66) Rate per 10,000 person-years 37 25

*Mean follow-up in CEE+MPA vs placebo arms: 4.05 ± 1.19 years.

†Mean follow-up in CEE alone vs placebo arms: 5.21 ± 1.73 years.

WHIMS: Mild Cognitive Impairment

E+P (n = 2229) Placebo (n = 2303) HR (95% CI) Cases of mild cognitive impairment* 56 55 1.07 (0.74–1.55) Rate per 10,000 person-years 63 59 E Alone (n = 1464) Placebo (n = 1483) HR (95% CI) Cases of mild cognitive impairment† 76 58 1.34 (0.95–1.89) Rate per 10,000 person-years‡ 102 76

Shumaker SA, et al. JAMA. 2003;289:2651-62. Shumaker SA, et al. JAMA. 2004;291:2947-58. *Mean follow-up in CEE+MPA vs placebo arms: 4.05 ± 1.19 years.

†Mean follow-up in CEE alone vs placebo arms: 5.21 ± 1.73 years. ‡Calculated from published data.

WHIMS CEE+MPA: Cumulative HR for a Diagnosis of Probable Dementia

Shumaker SA, et al. JAMA. 2003;289:2651-62.

0.01 0.02 0.03 1 2 3 4 5 Years Since Randomization Cumulative Hazard HR, 2.05 95% CI, 1.21–3.48 CEE/MPA Placebo Number of Events CEE/MPA 5 7 8 11 4 Placebo 3 2 3 3 9

Shumaker SA, et al. JAMA. 2004;291:2947-58.

WHIMS CEE Alone Study: Cumulative HR for a Diagnosis of Probable Dementia

0.00 0.02 0.04 0.06 0.08 0.10 1 2 3 4 5 6 7 8 Years Since Randomization Cumulative Hazard HR = 1.49 95% CI = 0.83–2.66 CEE Alone Placebo

  • No. of Events

CEE Alone Placebo 3 1 4 3 2 3 5 3 9 5 2 2 3 2

slide-10
SLIDE 10

9/27/2017 10

2 4 6 8 10 12 14 16 18 20 1 2 3 4 5 Years of Follow-Up Number of Events CEE/MPA Placebo

Mild Cognitive Impairment

WHIMS: Effect of CEE+MPA on Mild Cognitive Impairment and Probable Dementia

2 4 6 8 10 12 14 16 18 20 1 2 3 4 5 Years of Follow-Up Number of Events CEE/MPA Placebo

Probable Dementia

Shumaker SA, et al. JAMA. 2003;289:2651-62.

WHIMS Summary

– Significant increase in risk of all‐cause dementia in the CEE+MPA arm, but not significant in the CEE alone arm – No significant increase in mild cognitive impairment – AD was not evaluated as a separate outcome

Shumaker SA, et al. JAMA. 2003;289:2651-62. Shumaker SA, et al. JAMA. 2004;291:2947-58.

WHI CEE+MPA: During Study and Follow-up Stroke

39 9/27/2017 University Hospitals Case Medical Center / Case Western Reserve University School of Medicine

Modified from Heiss et al. JAMA 2008;299:1036-45

Proportion Women's Health Initiative Steering Committee. JAMA. 2004;291:1701-12.

0.00 0.01 0.02 0.03 0.04 0.05 1 2 3 4 5 6 7 8

Time (years) Cumulative Hazard CEE Placebo

Kaplan-Meier Estimate

HR = 1.39 95% nCI = 1.10–1.77 95% aCI = 0.97–1.99

WHI Results: Effect of CEE Alone

  • n Risk of Stroke
slide-11
SLIDE 11

9/27/2017 11

CARDIOVASCULAR

Off Target Effects

41

POSTMENOPAUSAL ESTROGEN/PROGESTIN INTERVENTIONS PEPI TRIAL (1989-1991) Post Rx Lipoproteins

JAMA 273:199-208, 1995

  • 20
  • 10

10 20 Placebo CEE CEE + MPA (cyc) CEE + MPA (con) CEE + P4 (cyc) HDL-C (mg/dL) LDL-C (mg/dL) Total Chol (mg/dL) Trigly (mg/dL)

  • 1.2

5.6 1.6 1.2 4.1

  • 4.1
  • 14.5
  • 17.7
  • 16.5
  • 14.8
  • 3.2
  • 7.6
  • 14.1
  • 14
  • 7.8
  • 3.2

13.7 12.7 11.4 13.4

43 PLoS Medicine 2015; 12(6): e1001833

  • CEE- n=220

tE2- n=211 Placebo n=262

Carotid Intimal Thickness

Coronary Artery Calcium

KEEPS Study: Impact of Micronized Progesterone

All E subjects took 200 mg P4 x 12d/m

Elite Trial:Timing Hypothesis and Progesterone Use

Hodis et al N Engl J Med 2016; 374:1221-1231

Early Menopause < 6 yrs Late Menopause >10 yrs

  • E2 1 mg/d with Vaginal Progesterone Gel 45 mg X 10d/m
slide-12
SLIDE 12

9/27/2017 12

Elite Trial: Timing Hypothesis and Progesterone Use

Hodis et al. N Eng J Med 2016;374:1221-31

Early Menopause < 6 yrs Late Menopause >10 yrs

WHI CEE+MPA: Study and Follow‐up Coronary Heart Disease

46 9/27/2017

Modified from Heiss et al. JAMA 2008;299:1036-45

WHI E+P: During Study and Follow-up Pulmonary Embolism

47 9/27/2017 University Hospitals Case Medical Center / Case Western Reserve University School of Medicine

Modified from Heiss et al. JAMA 2008;299:1036-45

1Writing Group for the Women's Health Initiative Investigators. JAMA. 2002;288:321-33; 2Women's Health Initiative

Steering Committee. JAMA. 2004;291:1701-12; 3Hulley S, et al. JAMA. 1998;280:605-13.

Total Mortality in WHI and HERS

WHI1,2 HERS3 Outcomes CEE/MPA (n = 8506) Placebo (n = 8102) CEE Alone (n = 5310) Placebo (n = 5429) CEE/MPA (n = 1380) Placebo (n = 1383)

CHD death

65 55 93 95 71 58

Cancer death

107 88 114 126 19 24

Other deaths

43 58 71 51 37 36

Unadjudicated deaths

16 17 13 17 4 5

Total deaths

231 218 291 289 131 123

slide-13
SLIDE 13

9/27/2017 13

Summary of Randomized Controlled Trials: CHD and Overall Mortality

Trial Treatment Length (yrs) CHD RR (95% CI) Total Mortality RR (95% CI)

HERS1* Oral CEE + MPA 4.1 0.99 (0.80–1.22) 1.08 (0.84–1.38) PHASE2 Transdermal E alone or with NE 2.6 1.29 (0.84–1.95) Not reported ESPIRIT3 Oral E valerate 2.0 0.99 (0.70–1.41) 0.79 (0.50–1.27) WHI E+P4* Oral CEE + MPA 5.2 1.29 (1.02–1.63) 0.98 (0.82–1.18) WHI-E5 Oral CEE 6.8 0.91 (0.75–1.12) 1.04 (0.88–1.22)

NE = norethisterone. *“Early” CHD events; †No “early” CHD events.

1Hulley S, et al. JAMA. 1998;280:605-13; 2Clarke SC, et al. Br J Obstet Gynecol. 2002;109:1056-62; 3Cherry N, et al.

  • Lancet. 2002;360:2001-8; 4Writing Group for the Women’s Health Initiative Investigators. JAMA 2002;288:321-33;

5The Women's Health Initiative Steering Committee. JAMA 2004;291:1701-12.

Summary of Serial Arterial Imaging Controlled Trials Coronary Artery Stenosis

Trial Treatment Length (yrs) Outcome P

ERA1 Oral CEE + MPA Oral CEE alone 3.2 Placebo: –0.09 mm CEE: –0.09 mm CEE + MPA: –0.12 mm 0.38 WAVE2 Oral CEE + MPA 2.8 Placebo: –0.024 mm/y CEE + MPA: –0.047 mm/y 0.17 WELL- HART3 Oral 17β-E + MPA Oral 17β-E alone 3.3 Placebo: ∆1.89% S 17β-E + MPA: ∆1.24% S 17β-E: ∆2.18% S 0.66 EPAT4 Oral 17β-E 2.0 Placebo: 0.0036 mm/y 17β-E: –0.0017 mm/y 0.046

S = stenosis.

1Herrington DM, et al. N Engl J Med. 2000;343:522-9; 2Waters DD, et al. JAMA. 2002;288:2432-40; 3Hodis HN, et al. N

Engl J Med. 2003;349:535-45; 4Hodis HN, et al. Ann Intern Med. 2001;135:939-53.