
19/09/2017 1
By Klaus Schade 19 September 2017
Institute for Public Policy Research
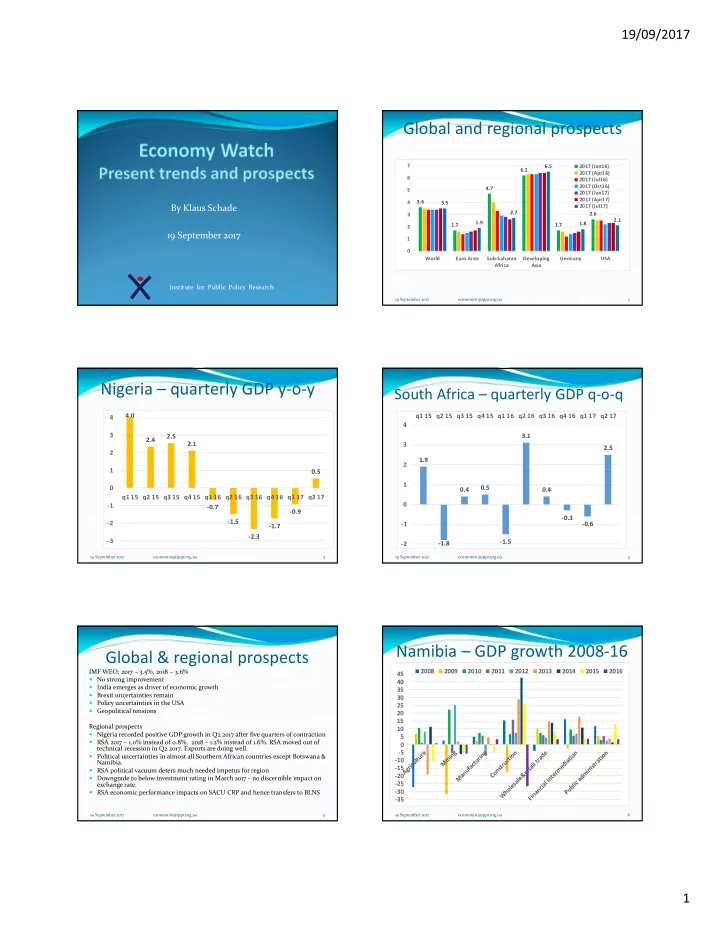
Global and regional prospects
3.6 1.7 4.7 6.2 1.7 2.6 3.5 1.9 2.7 6.5 1.8 2.1 1 2 3 4 5 6 7 World Euro Area Sub-Saharan Africa Developing Asia Germany USA 2017 (Jan16) 2017 (Apr16) 2017 (Jul16) 2017 (Oct16) 2017 (Jan17) 2017 (Apr17) 2017 (Jul17)
19 September 2017 economist@ippr.org.na 2
Nigeria – quarterly GDP y-o-y
4.0 2.4 2.5 2.1
- 0.7
- 1.5
- 2.3
- 1.7
- 0.9
0.5
- 3
- 2
- 1
1 2 3 4 q1 15 q2 15 q3 15 q4 15 q1 16 q2 16 q3 16 q4 16 q1 17 q2 17
19 September 2017 economist@ippr.org.na 3
South Africa – quarterly GDP q-o-q
1.9
- 1.8
0.4 0.5
- 1.5
3.1 0.4
- 0.3
- 0.6
2.5
- 2
- 1
1 2 3 4 q1 15 q2 15 q3 15 q4 15 q1 16 q2 16 q3 16 q4 16 q1 17 q2 17
19 September 2017 economist@ippr.org.na 4
Global & regional prospects
IMF WEO: 2017 – 3.5%, 2018 – 3.6% No strong improvement India emerges as driver of economic growth Brexit uncertainties remain Policy uncertainties in the USA Geopolitical tensions Regional prospects Nigeria recorded positive GDP growth in Q2 2017 after five quarters of contraction RSA 2017 – 1.0% instead of 0.8%, 2018 – 1.2% instead of 1.6%. RSA moved out of technical recession in Q2 2017. Exports are doing well. Political uncertainties in almost all Southern African countries except Botswana & Namibia. RSA political vacuum deters much needed impetus for region Downgrade to below investment rating in March 2017 - no discernible impact on exchange rate. RSA economic performance impacts on SACU CRP and hence transfers to BLNS
19 September 2017 economist@ippr.org.na 5
Namibia – GDP growth 2008-16
19 September 2017 economist@ippr.org.na 6
- 35
- 30
- 25
- 20
- 15
- 10
- 5
5 10 15 20 25 30 35 40 45 2008 2009 2010 2011 2012 2013 2014 2015 2016