SLIDE 1
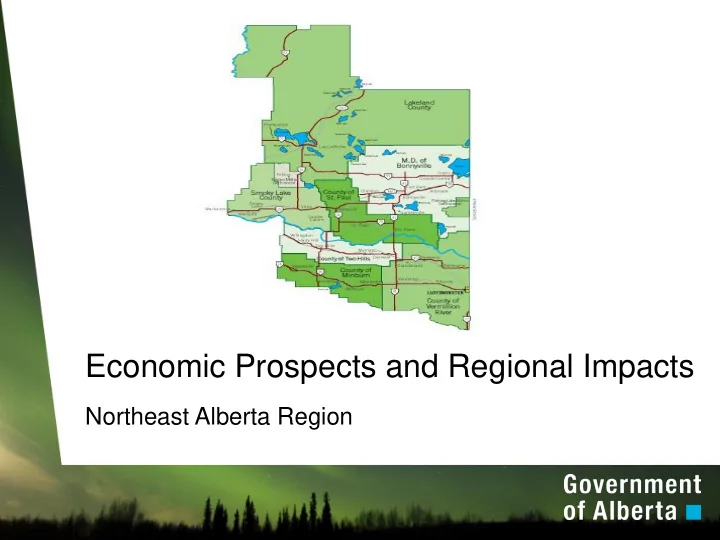
Economic Prospects and Regional Impacts
Northeast Alberta Region
SLIDE 2 Overview
Resources Available Key Regional Industries Key Regional Business / Labour Indicators Global Economic Perspectives Objectives
2
SLIDE 3
Objectives
The goal of this presentation is to assist regional economic development practitioners and stakeholders in gaining a better understanding of economic information at the regional level. The presentation will focus on a key regional industry, business, employment and economic indicators. It is not meant to be a comprehensive regional economic overview or forecast. Interpretation and application of this information is left to audience.
3
SLIDE 4
Questions We Need to Ask
What does this information mean to our region? Why is this information important to us? How could this information affect our understanding of the region’s economy, and our role in strategic planning and decision making?
4
SLIDE 5 Pulse of the World Economy
5
Euro recession means increasing risks
Weak US employment and housing starts
- Less demand for commodities
Strong growth in China continues
SLIDE 6 Bucking the Trend
Canadian recovery based on strength of domestic economy
dependent on U.S. economy Strong Canadian Dollar
- Weaker exports, increased
imports Energy sector fuelling growth
- Western Canada job creation,
income growth
6
SLIDE 7 Alberta Forges Ahead
Economy grew by 3.3% in 2010
- Strong growth in drilling;
agriculture; construction; manufacturing; wholesale Strong energy prices
- Fueling investment, exports,
manufacturing growth Energy sector fueling job gains
- Tighter job market, income and
retail sales growth
7
SLIDE 8
Alberta Economic Dashboard ’11
8
Retail Sales 6.9% Housing Starts (’11) 2.2% Oil Production 7.8% Gas Production 3.6% Rig Activity (‘11 ) 38% Employment (Dec) 4.9% Manufacturing Sales 18% Farm Cash Receipts 15% Exports 16%
SLIDE 9 Real GDP Growth – A Comparison
Sources: Statistics Canada, Bureau of Economic Analysis (historical); average of recent forecasts by major Canadian banks
9
3.0 1.7 2.1 0.7
3.2 2.3 2.0
0.9
3.3 3.3 3.1
2008 2009 2010 2011(f) 2012(f) Percent Change US Can AB
SLIDE 10 Things to Watch
10
Strong Canadian Dollar
- Limiting export growth
- Cheaper machinery/equipment
Oil Prices High, Gas Prices Low
- China/India driving long term
- il prices
- U.S. shale gas displacing
traditional customers Agriculture on Rebound
SLIDE 11 What makes up Alberta’s Economy?
11
Percentage Distribution of GDP Total GDP: $263.5 Billion
Sources: Statistics Canada and Alberta Treasury Board and Enterprise
Energy 25.7% Manufacturing 6.2% Transportation & Utilities 6.3% Business & Commercial Services 9.4% Finance & Real Estate 14.8% Tourism & Consumer Services 5.0% Retail & Wholesale 8.6% Public Administration 3.8% Education 3.8% Health 5.3% Agriculture 1.5% Construction 9.6%
SLIDE 12 Regional Employment Growth
(December 2010 - December 2011)
12
Wood Buffalo – Cold Lake +3.5% Athabasca-Grande Prairie +4.4% Edmonton Region +5.2% Red Deer Region +5.6% Banff-Jasper Rocky Mtn. House 0.0% Calgary Region +4.9% Camrose-Drumheller +1.8% Lethbridge-Medicine Hat +5.5% Provincial Rate +4.9%
Note: regional rates are 3-month averages Source: Statistics Canada, Labour Force Survey
SLIDE 13
Northeast Indicators
13
SLIDE 14 Major Construction Projects
14
Economic Indicators: Northeast Region
Major Construction Projects, as of September 30, 2011 Industry Sector Number of Projects Value ($millions) Biofuels 3 $321.6 Commercial/Retail 3 $36.7 Infrastructure 23 $368.7 Institutional 4 $82.4 Oil Sands 4 $5,210.0 Pipelines 2 $38.5 Residential 2 $10.5 Tourism/Recreation 3 $90.3 Total 44 $6,158.7 % of Provincial Total 4.8% 3.2%
Source: Alberta Treasury Board and Enterprise, Inventory of Major Alberta Projects
SLIDE 15 Building Permits
2.80% 2.4% 3.62% 2.9% 2.55% 2.3% 0.0 100.0 200.0 300.0 400.0 500.0 600.0 2010 2009 2008 2007 2006 2005
Value of Building Permits Northeast Region
Institutional Industrial Commercial Residential % of Provincial Total $Millions
Source: Statistics Canada, Compilations by Alberta Treasury Board & Enterprise
15
SLIDE 16 Number of NE Businesses by Industry
Agriculture & Forestry 8% Mining, Oil & Gas Extraction 8% Utilities & Construction 13% Manufacturing 2% Retail & Wholesale Trade 15% Transportation & Warehousing 9% Information, Culture, Recreation & Arts 2% Finance, Insurance, Real Estate & Leasing 5% Professional, Scientific & Technical Services 10% Administrative & Waste Management Services & Management of Companies 5% Accommodation & Food Services 4% Other Services Excluding Private Household Services* 11% Public Sector 8%
16
Source: Statistics Canada’s Business Register
SLIDE 17 A Region That Works
- Unemployment rate in region: 4.1% in ‘10 (6.5% for AB)
- Employment rate: 70.6% (68.1% for AB)
- Participation rate: 73.6% (72.9% for AB)
17
16% 12% 10% 10% 9% 5% 38%
Employment Share (%) by Sector
Forestry, mining, oil & gas Retail trade Health care Construction Education Agriculture Other
SLIDE 18 Workforce Characteristics
secondary degree, 11% less than AB average (working age population)
certificate versus 12.4% provincially
18
SLIDE 19 Wages and Salaries
19
Alberta Wage and Salary Survey - 2009
Northeast Region Alberta Average Hourly Wage Hiring Difficulties Average Hourly Wage Hiring Difficulties Total, All Industries $23.47 49% $24.34 41% Oil & Gas Extraction $40.06 47% $43.53 17% Construction $28.24 54% $28.50 61% Manufacturing $20.40 39% $24.70 54% Wholesale Trade $23.74 45% $27.09 40% Retail Trade $17.29 47% $17.31 41% Transportation & Warehousing $24.58 76% $24.31 51% Finance, Insurance & Real Estate $23.73 42% $24.02 33% Scientific, Technical & Professional Services $29.64 32% $34.56 45% Health Care & Social Services $23.43 49% $26.33 51% Accommodation & Food Services $11.43 87% $11.95 65%
Source: 2009 Alberta Wage and Salary Survey
SLIDE 20
Consumer Prices
20
SLIDE 21 Northeast Energy Sector
Drilling activity remains strong
- 19% of Alberta wells drilled
Natural gas production down
Crude oil production up
production
- Bitumen production up 17%
21
Source: Energy Information Agency ($US)
SLIDE 22 Conventional Energy Production
0.0% 1.0% 2.0% 3.0% 4.0% 5.0% 6.0% 7.0% 8.0% 2003 2004 2005 2006 2007 2008 2009 2010
Northeast's Share of Conventional Alberta Oil & Gas Production
Gas Crude Oil
Source: Alberta Energy
22
SLIDE 23 A Growing Source of Energy
5 10 15 20 25 30 2003 2004 2005 2006 2007 2008 2009 2010
Millions
Unconventional Oil Production (m3)
Source: Alberta Energy
23
SLIDE 24 NE Alberta Ranching 2010
Value of NE livestock $450 million (‘06 Census) Country of origin labeling and strong dollar affecting exports to U.S. Cattle and calves
- 629,000; 10% of AB
- Herd size down 41% from 2005
24
SLIDE 25 Ranchers Feeling the Pinch
Source: Statistics Canada
25
SLIDE 26 NE Alberta Farming 2010
Alberta cropland
largest canola producers (13%)
will benefit Alberta crop growers
26
SLIDE 27 4 Wing Presence – Cold Lake
Total Population ~ 13,900
- 41% of Cold Lake population
Military Community ~ 5,300
- Regular ~ 1,700
- Reserve ~ 130
- Civilians ~ 500
- Dependants ~ 3,000
- Est. Economic Impact ~ $235M+
- Wages ~ $129M
- Operations ~ $106M
Source: CFB 4 Wing, Cold Lake
27
SLIDE 28 Slowdown in Defense Spending?
“Military spending of about $20 billion will slow in two years, providing the Armed Forces with $525 million less than previously planned in 2012-13 and $1 billion less than expected in 2013-14”.
“Military to freeze size of forces, sell
- ff property”
- Edmonton Journal
28
SLIDE 29 Based on what you have seen…
…how can we use this information to support
- ur economic development strategies?
…what should we monitor or investigate further? …how can we use this information to support business retention, expansion and new investment?
29
SLIDE 30
For More Information
Northeast Alberta Information HUB Bob Bezpalko, Manager 780.614.3715 or Bobbezpalko@albertahub.com Regional Development Branch Rick Bastow, Northeast Regional Manager 780.645.6460 or Rick.Bastow@gov.ab.ca Regional Economic Indicator Reports:
www.albertacanada.com/about-alberta/regional-economic-indicators.html 30