
SLIDE 1
|
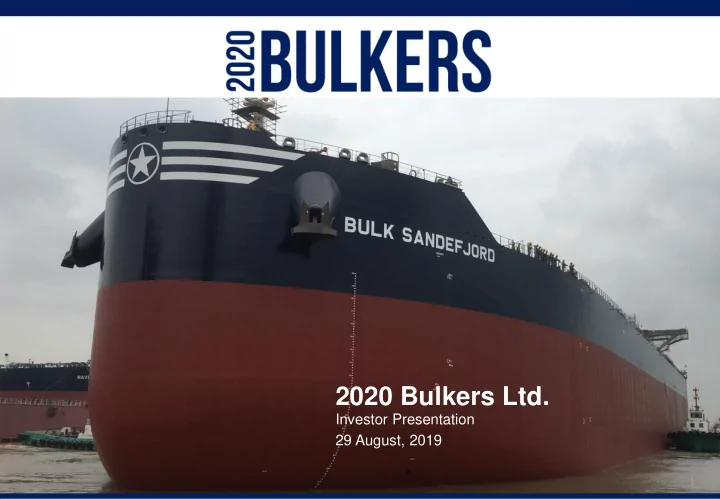
2020 Bulkers Ltd.
Investor Presentation 29 August, 2019
2020 Bulkers Ltd. Investor Presentation 29 August, 2019 | - - PowerPoint PPT Presentation
2020 Bulkers Ltd. Investor Presentation 29 August, 2019 | Disclaimer This presentation (the " Presentation ") has been prepared by 2020 Bulkers Ltd. (the " Company ") and is made 28 August, 2019 solely for information
|
Investor Presentation 29 August, 2019
|
2
This presentation (the "Presentation") has been prepared by 2020 Bulkers Ltd. (the "Company") and is made 28 August, 2019 solely for information purposes. The Presentation does not constitute any recommendation to buy, sell or otherwise transact with any securities issued by the Company. No representation, warranty or undertaking, express or implied, is made by the Company and no reliance should be placed on the fairness, accuracy, completeness or correctness of the information or the opinions contained herein. The Company shall have no responsibility or liability whatsoever (for negligence or otherwise) for any loss arising from the use by any person or entity of the information set forth in the Presentation. All information set forth in the Presentation may change materially and without
Presentation should be considered in the context of the circumstances prevailing at the date hereof and has not been and will not be updated to reflect material developments which may occur after such date unless specifically stated in such update(s). Matters discussed in the Presentation include "forward looking statements". "Forward looking statements" are statements that are not historical facts and are usually identified by words such as "believes", "expects", "anticipates", "intends", "estimates", "will", "may", "continues", "should" etc. These "forward looking statements" reflect the Company's beliefs, intentions and current expectations concerning, among other things, the Company's results, financial condition, liquidity position, prospects, growth and strategies. "Forward looking statements" include statements regarding: objectives, goals, strategies, outlook and growth prospects, future plans, events or performance and potential for future growth, liquidity, capital resources and capital expenditures, economic outlook and industry trends, developments in the Company's market, the impact of regulatory initiatives and the strength of the Company's competitors. "Forward looking statements" involve risks and uncertainties because they relate to events and depend on circumstances that may or may not occur in the future. The "forward looking statements" included herein are based upon various assumptions, many of which, in turn, are based upon further assumptions. This includes, without limitation, the Company's review of historical operating trends, data contained in the Company's records and data available from third parties. Although the Company believes that these assumptions were reasonable when the relevant statements were made, they are inherently subject to significant known and unknown risks, uncertainties, contingencies and other factors which are difficult or impossible to predict and which are beyond the Company's control. "Forward looking statements" are not guarantees of future performance and such risks, uncertainties, contingencies and other important factors which are inherent thereto could cause the actual results of operation, financial condition and liquidity position of the Company or the industry in which it operates to differ materially from those results which, expressed or implied, are contained herein. No representation to the effect that at any of the "forward looking statements" or forecasts will come to pass or that any forecasted result will be achieved are made. The Presentation and the information contained herein does not constitute or form a part of and should not be construed as an offer for sale or subscription or of solicitation or invitation of any offer to subscribe for or purchase any securities issued by the Company.
| 3
Attractive bank financing / Moderate leverage The right assets - 8 Scrubber fitted Newcastlemax with proven premium vs Capesize Free cash flow to be paid as dividends once fleet is delivered Stop investing as asset values and risk increases
Invest at attractive entry point
Low cost corporate structure Full alignment of interest as founders & management are largest shareholders
|
Earlier deliveries accellerates free cash flow generation
4
35,000 per day. Bi-weekly rate adjustement with current spot market implying TCE of USD ~43,000 per day1)
Name Built/Delivery Charter terms Charterer Bulk Sandefjord August, 2019 3 years index-linked timecharter with share of scrubber profit Koch Supply & Trading Bulk Santiago September, 2019 12-15 months timecharter @ usd 19,525 per day Koch Supply & Trading Bulk Seoul October, 2019 12-16 months timecharter @ usd 22,250 per day Koch Supply & Trading Bulk Shanghai November, 2019 Bulk Shenzen January, 2020 Bulk Sydney January, 2020 3 years index-linked timecharter with share of scrubber profit Koch Supply & Trading Bulk Sao Paulo April, 2020 Bulk Santos May, 2020
(1) Gross TCE rate based on Baltic 5TC index on 28 Aug, 2019
7,25 ship years on the water in 2020
|
5
Normalized cash break-even per vessel, per day Capesize historical rates(3) vs 2020 cash breakeven
Opex USD/d 4 750 G&A " 1 000 Debt amortization " 4 566 Interest expense(1) " 3 822 2020 Bulkers Cash Breakeven (CBE) @ 100% utilization " 14 138
“ (744)
" 2 840
" 3 122 = Standard Capesize rate2) required for index linked Newcastlemax to earn CBE 8 920
(1) Does not include interest on revolving credit facility. Assumes 3M Libor of 2.15%. (2) Baltic reference Capesize 180,000 DWT without scrubbers (3) 1 year TC for Baltic reference Capesize 180,000 DWT without scrubbers. Monthly data. Source: Company, Clarkson Research Services Limited (SIN)
Since 1990, Capesize rates have been above 2020 Bulkers’ cash breakeven indexed to a Baltic Type Capesize ~95% of the time(3)
10 20 30 40 50 60 70 80 Capesize dayrate (USD'000/day) 1 year Capesize TC rate 2020 BE non-scrubber Capesize equivalent 140 145 150 155 160 165
|
6
FREE CASH FLOW TO EQUITY PER SHARE STANDARD CAPESIZE RATE
NOK
20 30 40 50 60 70 80 10 000 15 000 20 000 25 000 30 000 35 000 40 000 45 000 50 000 2020 2021
|
7
production expected back by year end
during Q2
end 2018
are currently 25% down YOY
|
1) Mark to market - assuming 8 Newcastlemax trading spot at Index linked charter reflecting Baltic 5TC Index + 35% with 60% share of scrubber economics based on HFO vs LSFO spread of USD 200 per ton.
8
market lows in April 2019
implemented
|
9
|
455 551 484 315 370 283 249 248 229 206 161 81 51 55 100 200 300 400 500 600 Number of shipyards No of yards taking orders
Dry bulk orderbook as % of fleet Dry bulk Newbuild contracts(1) Number of active shipyards(2)
(1) For vessels larger than 20,000 dwt (2) With at least one order larger than 1,000 GT on order, includes merchant and ship-shaped offshore vessels Source: Clarkson Research Services Limited
10
20 40 60 80 100 120 2005 2006 2007 2008 2009 2010 2011 2012 2013 2014 2015 2016 2017 2018 2019 USDbn Bulk carriers 0% 10% 20% 30% 40% 50% 60% 70% 80% Orderbook as % of fleet Dry Bulk
|
Source: Arrow Shipbrokering group Calculations: Company
11
Capesize scrubber retrofitting timeline Increased reports of delays for scrubber retrofits ▪ Average retrofit times estimated around 40 days, with reports
▪ Some repair yards have overbooked their capacity ▪ Reports of delayed deliveries of scrubbers from manufacturers Capesize scrubber installations by end 2020
50 100 150 200 250 300 jan.19 feb.19 mar.19 apr.19 mai.19 jun.19 jul.19 aug.19 sep.19
nov.19 des.19 jan.20 feb.20 mar.20 apr.20 mai.20 jun.20 jul.20 209 446 35 142 60 90 180 270 360 450 To be fitted Under discussion Potential* Already fitted Total
Impact on non scrubber fitted Capesize vessels Decrease in optimal speed
Portion of fleet without scrubber YE 2020 80 % Avg time at sea 65 % Reduction in effective supply
Impact on scrubber fitted Capesize vessels Increase in optimal speed 3,60 % Portion of fleet with scrubber YE 2020 20 % Avg time at sea 65 % Increase in effective supply 0,5 % Net reduction in effective Capesize supply
Higher fuel prices will reduce speeds for ships without scrubbers
|
0,00 0,20 0,40 0,60 0,80 1,00 1,20 1,40 1990 1992 1994 1996 1998 2000 2002 2004 2006 2008 2010 2012 2014 2016 2018 Billion tonnes World Seaborne Total Coal Trade 0,00 0,20 0,40 0,60 0,80 1,00 1,20 1,40 1,60 1990 1992 1994 1996 1998 2000 2002 2004 2006 2008 2010 2012 2014 2016 2018 Billion tonnes World Seaborne Iron Ore Trade
12
World seaborne iron ore trade (28.2% of dry bulk trade in 2018) World seaborne coal trade (23.8% of dry bulk trade in 2018)
Source: Clarkson Research Services Limited (SIN)
The iron ore trade has been expanding 25 out of last 29 years, with 5.0% CAGR The coal trade has been expanding 28 out of last 29 years, with 4.7% CAGR
|
Chinese steel production remains strong… While Chinese mills have been destocking iron ore inventories1)
13
10 20 30 40 50 60 70 80 90 100 Jan-05 Jan-07 Jan-09 Jan-11 Jan-13 Jan-15 Jan-17 Jan-19 Tons per month (million) China steel production 0,1 0,2 0,3 0,4 0,5 0,6 0,7 0,8
Iron ore inventories at mills million tons (1) Inventory shown as average per mill based on survey sample of 64 mills, representing ~30% of Chinese steel output Source: MySteel, Bloomberg, J.P. Morgan, Reuters, Company, Clarkson Research Services Limited (SIN)
|
Brazilian iron ore shipments Australian iron ore shipments
Source: Arrow Shiprbroking Group
14
2 3 4 5 6 7 8 9 10 jan feb mar apr mai jun jul aug sep
nov des
Million tonnes, 3-week moving average
2018 2019 10 12 14 16 18 20 jan feb mar apr mai jun jul aug sep
nov des
Million tonnes, 3-week moving average
2018 2019
|
Key Brazilian production impacts
MTPA Expected timing Lost production after Brumadinho accident
1H 2019 Restarts and new capacity Brucutu restart 30 2Q 2019 Various Vale dry processing capacity restarts 30 2H 2019 S11D 20 ramp up Minas Rio 15 ramp up Samarco restart 30 during 2020 Total restarts and new capacity 125 Total expected production increase YE 2018- YE 2020 32
Vale iron ore shipments by system Brazil Iron ore shipments ex-Vale
Source: Arrow Shiprbroking Group Calculations: Company
15
1,0 1,5 2,0 2,5 3,0 3,5 4,0 4,5 jan.18 jan.18 feb.18 mar.18 mar.18 apr.18 mai.18 mai.18 jun.18 jul.18 jul.18 aug.18 sep.18
nov.18 des.18 des.18 jan.19 feb.19 feb.19 mar.19 apr.19 apr.19 mai.19 jun.19 jul.19 jul.19 aug.19
million tonnes, 3-week moving average
Northern Southern & South Eastern
200 400 600 800 1000 jan.18 feb.18 mar.18 apr.18 mai.18 jun.18 jul.18 aug.18 sep.18
nov.18 des.18 jan.19 feb.19 mar.19 apr.19 mai.19 jun.19 jul.19 aug.19
thousand tonnes, 3-week moving average
Comments:
least 30 million tons year end 2020 vs year end 2018.
production closed after the dam accident where Vale has said timing for resumed production is 2-3 years out
7 million tons, which corresponds to annualized disruputed volumes of 120 capesize equivalents
|
16
|
17
▪ 17% higher cargo capacity for USD 2,5 - 3m incremental capex compared to Capesize newbuilds ▪ Drybulk freight is priced on a USD/ton basis, meaning a Newcastlemax can be expected to earn significantly higher time charter equivalent earnings compared to a standard Capesize while performing the same trade ▪ At 2020 FFA freight rates a Newcastlemax trading in the spot market would earn around USD 1,7 million higher time charter equivalent earnings per year, compared to a standard Capesize ▪ Present value of USD 1,7 mill incremental cashflow over a 20 year expected life is USD 10 million if discounted at 15% Newcastlemax can perform all key Iron Ore trades
Simplified Voyage economics Newcastlemax vs Capesize Additional cargo loaded (actual) MT 25 000 Freight rate for C5 (W Australia – China) $ 8,35 Addition revenue per voyage (net of commission) $ 216 250 Additional fuel, broker’s fees $
Additional cash flow per voyage $ 191 250 Voyage per year X 10 Additional cash flow per year (adj for 95% utilization) $ 1 816 875 Discount rate % 15 % Present value of additional cash flow $ 10 372 423 Sensitivity Present value Discount rate 10 % USD 15,5 mill 15 % USD 11,4 mill 20 % USD 8,9 mill
Note: Illustrative economics showing present value of additional revenue compared to Capesize earnings calculated over 20 years. Additional DWT capacity vs a Capesize is 28,000 DWT, however calculation assumes 25,000 in actual additional cargo loaded. Calculation assumes 1 ton per day higher fuel consumption for Newcastlemax vs Capesize Source: Company, Clarksons Platou SeaNet
Greater cargo intake yields higher earnings
|
18 ▪ The differential in Newbuild prices between a Newcastlemax and a Capesize is approximately USD 2,5 mill and reflects the additional steel and labor cost ▪ Based on 2020 FFA prices for West Australia – China in USD per ton a Newcastlemax would over a 20 year life be expected to earn approximately USD 34 mill more than a Capesize ▪ Broker valuation curves are based on depreciated newbuild prices and do not reflect the incremental earnings power of a Newcastlemax, compared to a Capesize
Evident by Newcastlemax taking market share vs Capesize
Source: Company, Clarksons Platou
Current newbuild prices undervalue the cash flow of a Newcastlemax relative to a standard Capesize
6% 39% 64% 75% 74% 100% 0% 20% 40% 60% 80% 100% 120% 10 years ago 5 years ago 2019 2020 2021 2022
Newcastlemax deliveries as a % of Total Newcastlemax + Capesize deliveries
10 20 30 40 50 60 70 1 2 3 4 5 6 7 8 9 10 11 12 13 14 15 16 17 18 19 20 21 Broker quote Capesize Broker quote Newcastlemax PV Nmax vs Cape @ 15%
|
IMO 2020 Sulphur regulations Simplified analysis of scrubber investment Scrubber investment sensitivity
19
Discount rate % LSFO-HFO spread USD/t
▪ New IMO regulations with take effect on January 1st 2020 ▪ The regulation restricts maximum SOx (Sulphur Oxide) content in emissions for shipping vessels to be reduced from 3.5% to 0.5% ▪ Three ways for a ship owner to comply: ✓ Install scrubbers − Enables ship to keep running on HFO − Current Capex of around USD 2,5 million for a Newcastlemax vessel − Short payback time − More complicated for retrofits and may need to take ship out of service ✓ Run ships on MGO or other compliant Low Sulphur Fuel − Easiest way to comply, as well as the only way to comply without significant Capex to owner − MGO for 2020 is significantly more expensive than HFO − May require increased engine maintenance ✓ Burn LNG as fuel − Significant Capex (adds around 20% to newbuilding cost) − Long-term attractive solution as LNG has broken parity with oil and LNG also addresses CO2 emissions
Source: Company
Fuel spread USD/tonne 3,8 200 350 500 10 % 3,4 6,0 8,6 15 % 3,0 5,3 7,6 20 % 2,7 4,7 6,8 Illustrative scrubber savings, W Australia - China RV Tons HFO consumed 852 LSFO-HFO spread (2020) 200 RV days 36 Share of fuel savings 50% Daily Savings 2 354 Discount rate 10 % PV (5 years) 3,3
|
20
Illustrative TCE Comparison Baltic type Capesize vs 2020 Bulkers Newcastlemax with scrubber trading on voyage charter
Source: Baltic Exchange, Company
Assumptions: Input as of July 22, 2019: 2020 FFA market of USD 8,65 per ton for C5 (West Australia – China round voyage). 2020 forward fuel prices (Singapore)
r
Baltic C5 2020 C5 Delta Comment Key variables USD/ton (FFA for 2020 WA-China) 8,65 8,39
Cargo Intake (tonnes) 175 000 205 000 Assumed actual intake Consumption laden - 12 knots 43,0 37,2 Consumption balast 13 knots 43,0 33,7 HFO Price (2020 fwd price) NA 300 LSFO Price (2020 fwd price) 500 500 TCE calculation Net Freight 1 438 063 1 634 050 14 % Higher cargo Intake, 3% lower USD/ton rate HFO cost
LSFO cost
Total Fuel Cost
Port costs
Misc Costs
P&L 593 350 1 059 290 TCE net 17 342 29 453 70 %
|
Simplified Sources and uses Comments Uses: ▪ Total cost for 8 Newbuildings of USD 376m, including building supervision (USD 47m per vessel) Sources: ▪ Equity raised to date of USD 142m ▪ Secured bank financing at attractive terms:
▪ USD 5,5m revolving credit facility from largest shareholder for working capital purposes
21
Uses of funds until delivery of first vessel USDm 8 x Newbuildings, including building supervision 376 Working capital, stores, spares, bunkers, G&A 6 Total uses of funds 382 Sources of funds USDm Equity raised to date 142 Bank financing 240 Total sources of funds 382
2020 Bulkers’ newbuild program is fully financed
|
22
Management Board of Directors
Executive committee
Pareto’s US Operations
Magnus Halvorsen | Chief Executive Officer
Vidar Hasund | Chief Financial Officer
Olav Eikrem | Chief Technical Officer
Drilling Ltd. (2011-2018), Archer Limited (2007-2018), Golden Ocean Group Ltd (2004-2018), Frontline Ltd. (2003- 2018), Avance Gas Holding Ltd (2013-2018), Ship Finance International Ltd (2003-2018), Golar LNG Ltd (2003- 2015), Golar LNG Partners LP (2007-2015), Seadrill Ltd (2005-2018), and Seadrill Partners LLC (2012-2018)
Alexandra Kate Blankenship | Director
Jeremy Kramer | Director
and Commercial Director (Sept 2004 – Apr 2008) at Frontline Management AS, Board Member at Frontline, Frontline 2012, Flex LNG, Frontline Shipping, Frontline Management (Bermuda), Seateam Ship Management
Singapore
Jens Martin Jensen | Director
Ltd., Ship Finance International Ltd., North Atlantic Drilling Ltd., Sevan Drilling Ltd., Northern Drilling Ltd., FLEX LNG Ltd., Seadrill Ltd., Knightsbridge Shipping Ltd., Golden Ocean Group Ltd., Golar LNG Ltd., Seadrill Partners LLC
(1993-2007)
Georgina Sousa | Director & Company Secretary
Experienced management and board incentivized to distribute free cash flow to shareholders
* Strike price for all outstanding options is USD 10 per share
|