
SLIDE 1
1
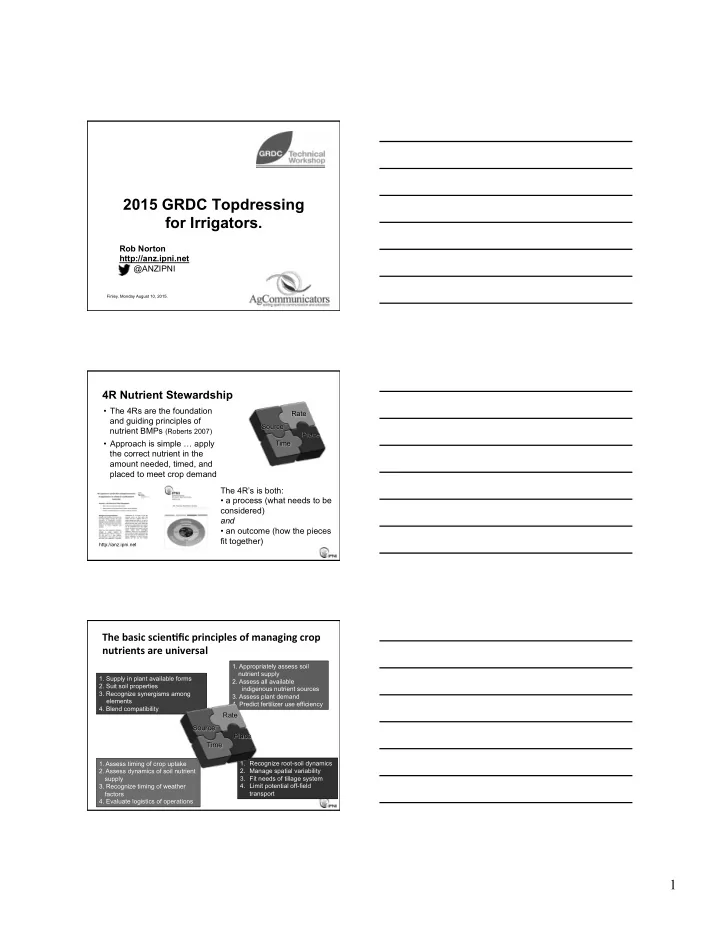
2015 GRDC Topdressing for Irrigators.
Finley, Monday August 10, 2015.
Rob Norton http://anz.ipni.net @ANZIPNI
4R Nutrient Stewardship
- The 4Rs are the foundation
and guiding principles of nutrient BMPs (Roberts 2007)
- Approach is simple … apply
the correct nutrient in the amount needed, timed, and placed to meet crop demand The 4R’s is both:
- a process (what needs to be
considered) and
- an outcome (how the pieces
fit together)
http://anz.ipni.net
Source Time Place Rate
- 1. Supply in plant available forms
- 2. Suit soil properties
- 3. Recognize synergisms among
elements
- 4. Blend compatibility
- 1. Appropriately assess soil
nutrient supply
- 2. Assess all available
indigenous nutrient sources
- 3. Assess plant demand
- 4. Predict fertilizer use efficiency
- 1. Assess timing of crop uptake
- 2. Assess dynamics of soil nutrient
supply
- 3. Recognize timing of weather
factors
- 4. Evaluate logistics of operations
- 1. Recognize root-soil dynamics
- 2. Manage spatial variability
- 3. Fit needs of tillage system
- 4. Limit potential off-field
transport
The ¡basic ¡scien+fic ¡principles ¡of ¡managing ¡crop ¡ nutrients ¡are ¡universal ¡ ¡
Source Time Place Rate