2015-12-08 Fact Based Program and Policy Development Competitive - - PDF document

2015 12 08
SMART_READER_LITE
LIVE PREVIEW

2015-12-08 Fact Based Program and Policy Development Competitive - - PDF document

2015-12-08 Fact Based Program and Policy Development Competitive intelligence, European 1994 : Canadian company international practices and challenges: Highlights information needs (DFAIT re- Presented by Jonathan Calof, analyzed)


slide-1
SLIDE 1

2015-12-08 1

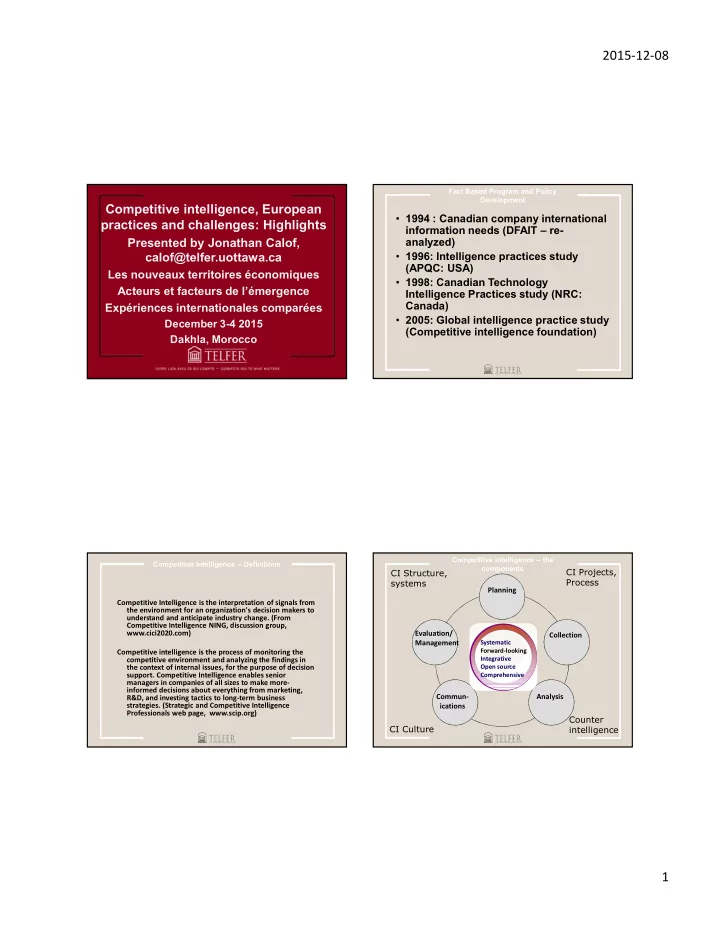
Competitive intelligence, European practices and challenges: Highlights

Presented by Jonathan Calof, calof@telfer.uottawa.ca

Les nouveaux territoires économiques Acteurs et facteurs de l’émergence Expériences internationales comparées

December 3-4 2015 Dakhla, Morocco

  • 1994 : Canadian company international

information needs (DFAIT – re- analyzed)

  • 1996: Intelligence practices study

(APQC: USA)

  • 1998: Canadian Technology

Intelligence Practices study (NRC: Canada)

  • 2005: Global intelligence practice study

(Competitive intelligence foundation)

Fact Based Program and Policy Development

Competitive Intelligence is the interpretation of signals from the environment for an organization's decision makers to understand and anticipate industry change. (From Competitive Intelligence NING, discussion group, www.cici2020.com) Competitive intelligence is the process of monitoring the competitive environment and analyzing the findings in the context of internal issues, for the purpose of decision

  • support. Competitive Intelligence enables senior

managers in companies of all sizes to make more- informed decisions about everything from marketing, R&D, and investing tactics to long-term business

  • strategies. (Strategic and Competitive Intelligence

Professionals web page, www.scip.org)

Competitive Intelligence – Definitions Competitive intelligence – the components

Collection Planning Analysis Evaluation/ Management

Systematic Forward-looking Integrative Open source Comprehensive

Commun- ications

CI Structure, systems CI Projects, Process CI Culture Counter intelligence

slide-2
SLIDE 2

2015-12-08 2

  • Regional economic development
  • Government policy development
  • Company projects for market selection,

product development….

  • Integrated trade show intelligence

missions for opportunity identification

Competitive Intelligence: Economic Development, Canadian examples

Two phases so far (on-going)

  • Online survey (through survey monkey): End of

September start, 158 responses received as of November 9

  • Survey administered at SCIP Europe conference

(November 5th): 35 respondents (roughly 40% response rate)

  • Eliminating overlap – 186 responses to date

Competitive intelligence practices – Background to study SCIP Teams up with 3 Universities in 3 Continents to Investigate Strategic & Intelligence Practice

(SCIP Weekly Newsletter / September 17, 2015)

Competitive intelilgence practices

Prescriptive and predictive: overall objective of intelligence is to help organizations deal with changes in the business environment

Response Percent Response Count 26.6% 47 53.7% 95 15.8% 28 4.0% 7 177 8 How well does your organization cope with changes in the business environment? Answer Options Above average (we cope very well) Average (we cope) Below average (we do not cope well) We drive the change (we are leaders in innovation) answered question skipped question

Competitive intelligence practices

Response Percent Response Count 14.0% 25 6.1% 11 1.7% 3 3.9% 7 6.7% 12 6.7% 12 60.9% 109 How many people are employed with your company? (please Answer Options <10 10-49 50-99 100-249 250-499 500-999 >1000

slide-3
SLIDE 3

2015-12-08 3

Competitive intelligence practices

Response Percent Response Count 25.7% 28 6.4% 7 13.8% 15 4.6% 5 2.8% 3 11.0% 12 0.0% 11.9% 13 8.3% 9 Other 15.6% 17 109 Which department / section of your organization is responsible for CI/env scanning? Answer Options Competitive Intelligence Business Intelligence Marketing Intelligence Market Insight Competitor Insight Strategic Planning Library / Information Services Marketing / Market Research Other (includes intel in title) answered question

Competitive intelligence practices

Below average Average Above+ 10% 37% 56% 10% 13% 18% 50% 37% 18% 30% 11% 6% 0% 2% 3% Informal Other How well does your organization cope with changes in the business environment Answer Options Centralized: one CI function De-centralized Mixed Response Percent Response Count 40.4% 44 12.8% 14 31.2% 34 11.9% 13 3.7% 4 109 How is the intelligence function structured in your organization? Answer Options Centralized: one CI function serves all or most of De-centralized: each department or functional line Mixed: some activities are centralized, others are Informal: no structured CI function at any level, CI Other (please specify) answered question

Competitive intelligence practices

All Most Some Few None Don't know or N/A 22% 17% 21% 14% 16% 11% 34% 24% 22% 10% 6% 5% 14% 33% 36% 9% 4% 5% Approximately how many individuals at these levels are primary clients of your CI Answer Options Board of Directors C Level (e.g. CEO, Management below C Yes No Don't know 41% 55% 5% 38% 57% 6% 45% 50% 6% 70% 30% 0% Does your organization's overall CI activities have: Answer Options A formal (written down) CI Strategy Formal (written down) CI Procedures Specific CI Ethical guidelines A manager function with CI Responsibilities

Competitive intelligence practices

Below average Average Above+ 22% 38% 53% 30% 41% 41% 64% 40% 50% 36% 79% 71% 2.3 2.5 2.8 1.4 1.9 2.3 1.1 2.4 2.2 1.9 2.8 3 Formal (written down) CI Procedures Specific CI Ethical guidelines A manager function with CI Responsibilities Board of Directors C Level (e.g. CEO, MD, CTO, CFO, CSO) How well does your organization cope with changes in the business environment A formal (written down) CI Strategy Know that Cl exists? Participate in CI activities (e.g. gather/ All Most Some Few None Don't know 17% 36% 35% 13% 0% 0% 6% 17% 50% 23% 4% 0% Approximately how many of your organization's employees: Answer Options Know that Cl exists? Participate in CI

slide-4
SLIDE 4

2015-12-08 4

13

Average %frequently or sometimes Below average Average Above average+ Market/Industry 2.4 83% 2.0 2.6 2.4 Competitive benchmarking 2.3 83% 2.2 2.4 2.3 Company profiles 2.3 81% 1.8 2.4 2.4 Early warning alert 1.9 66% 1.6 1.8 2.2 Economic analysis 1.8 61% 1.3 1.8 1.8 Technology assessments 1.7 59% 1.7 1.7 2.0 Customer profiles 1.6 54% 0.4 1.5 2.0 Executive profiles 1.5 47% 1.1 1.3 1.8 Political analysis 1.2 34% 0.8 1.1 1.4 Supplier profiles 1.2 34% 0.6 1.0 1.6 Depth 17.8 13.5 17.6 19.9 Average Frequently+ sometimes Below average Average Above average+ 2.4 90% 2.1 2.4 2.4 2.3 74% 1.5 2.3 2.5 1.5 46% 1.0 1.4 1.7 1.9 63% 1.1 1.9 2.2 2.1 72% 2.0 2.1 2.2 1.5 47% 0.9 1.3 1.8 1.9 66% 1.6 1.8 2.2 2.3 83% 2.0 2.3 2.2 Depth 15.7 12.2 15.5 17.2 Regulatory or legal Research or technology development Sales or business development Answer Options Corporate or Business strategy Market entry decisions Reputation management/ M&A, Due Diligence or Joint Venture Product development Decisions support by CI Organizations resp to env change

Competitive intelligence practices

% average 9.80 27.80 27.80 17.30 11.20 6.10 Communicating the intelligence Managing the project including Evaluating the intelligence project Breakdown of intelligence time Planning your intelligence project Collecting the information Analysis (piecing together

Response Average 47.1 21.4 7.4 6.4 6.4 3 4.5 3.8 % Time by target/focus Competitors Customers Government Suppliers Partners Universities Professional Associations Other Research Institutions

Response Average 50 37.1 9.7 3.2 6 - 10 years More than 10 years Less than 1 year 1 - 5 years How forward

  • riented

Analytical techniques used Response Percent Competitor Analysis 88.4% Technology Forecasting 81.4% SWOT Analysis 77.9% Benchmarking (Best practices) 70.9% Indications and Warning Analysis 58.1% Industry Analysis 55.8% Competitive Positioning Analysis 50.0% Customer Segmentation Analysis 47.7% Scenario Analysis 46.5% Financial Analysis and Valuation 34.9% Patent Analysis 34.9% GAP Analysis 33.7% Supply Chain Management (SCM) 33.7% Boston Consulting Group Growth/Share 31.4% Driving Forces Analysis 31.4% Product Life Cycle 31.4% Issue Analysis 31.4% Growth Vector Analysis 31.4% Data Visualization 30.2% Win / Loss Analysis 30.2% Financial Ratio and Statement Analysis 29.1% Business Model Analysis 29.1% War Gaming 29.1% Value Chain Analysis 25.6% SERVO Analysis 24.4% Stakeholder Analysis 24.4% Management Profiling 23.3% Linchpin Analysis 20.9% Macro-environmental (STEEP) 19.8% Analytics 18.6% General Electric Business Screen 18.6% Experience Curve Analysis 15.1% Product Line Analysis 14.0% S-Curve (Technology Life Cycle) 12.8% Strategic Group Analysis 12.8% Critical Success Factor Analysis 12.8% Shadowing 12.8% Blind-spot Analysis 11.6% McKinsey 7s Analysis 11.6% Strategic Relationship Analysis 11.6% Timeline / Event Analysis 10.5% Analysis of Competing Hypothesis 9.3% Customer Value Analysis 8.1% Sustainable Growth Rate 7.0% Historiographical Analysis 4.7% Functional Capability and Resource 3.5% Industry Fusion Analysis 1.2%

Competitive intelligene practices - analytics Response Percent 26.4% 55.7% 17.9% Business analytics used for CI Yes No Not sure Response Percent 25.7% 61.9% 12.4% Analytics for social media Yes No Not sure Accenture Bottlenose Brandwatch Business objects Cognos Crawlers Crystal ball Custom/Self built Eikon Excel GIA Plaza Google analytics Hadoop Hotsuite Hyperion Mbrain PowerPivot Qlikview Sales force SAP SAS

SDG/RMS Sentiment Smartstats SPSS Tableau Tweetdeck Wix Intelsuite

slide-5
SLIDE 5

2015-12-08 5

17

Very important Important+ somewhat important Not very important Not important 61% 35% 4% 0% 64% 33% 3% 0% 51% 36% 11% 2% 23% 42% 31% 5% 37% 52% 9% 2% 41% 46% 10% 3% 40% 50% 9% 1% 17% 54% 23% 6% 31% 57% 7% 4% 7% 37% 36% 19% 6% 46% 31% 16% Information sources used for CI Publications (print/online) Internet websites (free) Commercial databases (fee) Social media Internal databases Company employees Customers Suppliers Industry experts Government employees Association employees Overall Below average Average Above average_ 29.3 25.7 29.6 31.7 14.2 12.6 13.8 16.2 15.1 13.1 15.8 15.5 How well organization copes with changes in business environment Information source depth Overall Primary Secondary

Competitive intelligence practices: Management and evaluation Answer Options Response Percent Customer satisfaction 48.6% Decisions made/ supported 39.4% CI productivity/ output 28.4% Strategies enhanced 26.6% New products or services developed 23.9% We have no effectiveness or 22.9% New or increased revenue 19.3% New Products or services 16.5% Cost savings or avoidance 14.7% Financial goals met 14.7% ROI Calculation 13.8% Profit increases 13.8% Time savings 11.0% Competitive intelligence practices – Challenges for the future

To what extent would the following contribute to making your organizations CI more effective? Very important somewhat important Not important /not very Better integration of information from multiple sources 64% 33% 3% More training for individuals involved in intelligence development 37% 56% 7% More training for executives on how to use intelligence 38% 53% 9% Formal process to share information 36% 50% 14% Expanded access to information sources 40% 53% 6% Increased funding or reallocation of funds 28% 56% 16% Greater direct access to consumers of intelligence 28% 60% 13% Better use of internal technology systems 26% 58% 17% The adoption of new technology 31% 49% 20%

École de gestion Telfer Université d’Ottawa 55, avenue Laurier Est Ottawa ON K1N 6N5 Tél. : 613-562-5731 Télec. : 613-562-5164 Telfer School of Management University of Ottawa 55 Laurier Avenue East Ottawa ON K1N 6N5 Tel.: 613-562-5731 Fax: 613-562-5164 telfer.uOttawa.ca

For more information Jonathan Calof Professor calof@telfer.uottawa.ca