2/6/2019 ASSESSING THE OPTIC DISC: IS MAXIMIZING YOUR DIAGNOSTIC - - PDF document

2 6 2019
SMART_READER_LITE
LIVE PREVIEW

2/6/2019 ASSESSING THE OPTIC DISC: IS MAXIMIZING YOUR DIAGNOSTIC - - PDF document

2/6/2019 ASSESSING THE OPTIC DISC: IS MAXIMIZING YOUR DIAGNOSTIC PHOTOGRAPHY STILL TECHNOLOGIES: SOMETHING OLD, NECESSARY IN THE OCT ERA? NEW, BORROWED AND BLUE Joseph Sowka, OD Greg Caldwell, OD Joseph Sowka, OD Jessica Steen, OD


slide-1
SLIDE 1

2/6/2019 1

MAXIMIZING YOUR DIAGNOSTIC TECHNOLOGIES: SOMETHING OLD, NEW, BORROWED AND BLUE

Greg Caldwell, OD Joseph Sowka, OD Jessica Steen, OD

ASSESSING THE OPTIC DISC: IS PHOTOGRAPHY STILL NECESSARY IN THE OCT ERA? Joseph Sowka, OD GLAUCOMA SUSPECT BASED UPON DISC APPEARANCE

Larger discs will have larger cups, but rims are intact

  • Glaucoma is over-diagnosed in larger discs and under-

diagnosed in smaller discs

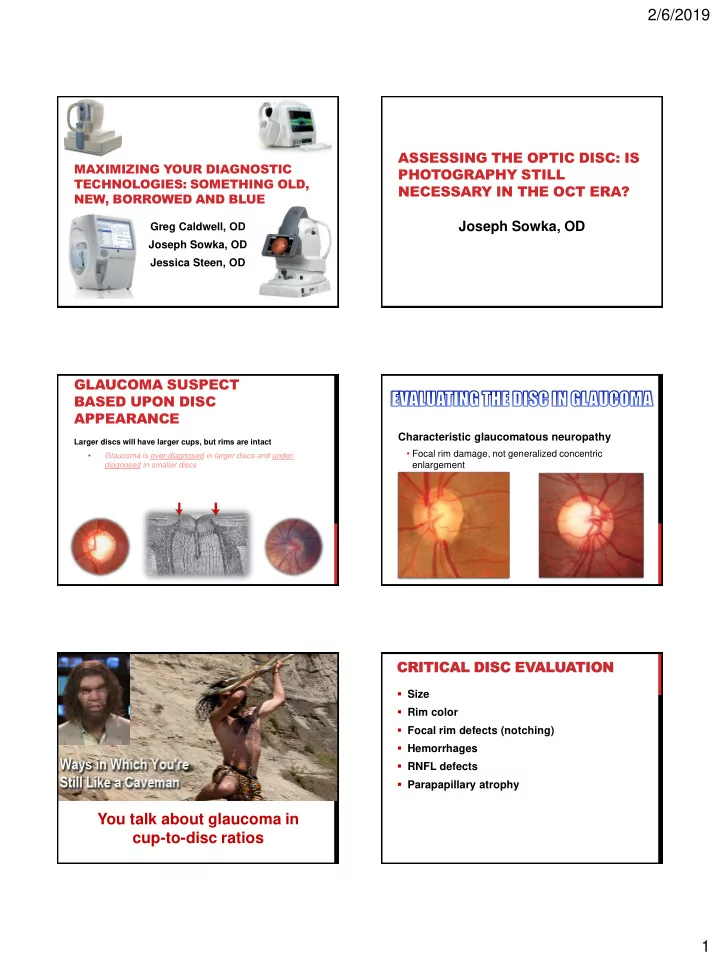
Characteristic glaucomatous neuropathy

  • Focal rim damage, not generalized concentric

enlargement

You talk about glaucoma in cup-to-disc ratios

CRITICAL DISC EVALUATION

  • Size
  • Rim color
  • Focal rim defects (notching)
  • Hemorrhages
  • RNFL defects
  • Parapapillary atrophy
slide-2
SLIDE 2

2/6/2019 2

METHODS OF DISC ASSESSMENT

  • Direct ophthalmoscopy
  • Binocular indirect ophthalmoscopy
  • Non-contact fundus lens biomicroscopy
  • Wide-field imaging?
  • Disc photography

OCT TO VERIFY GLAUCOMA – THE OPTIC NERVE HEAD?

ARE WE LOSING OUR ABILITY TO EXAMINE THE DISC? ODDS OF USAGE

  • Visual field utilization
  • Decreased from 65%-51% ophthalmologists
  • Decreased from 66%-44% optometrists
  • Overall decrease by 44%
  • Imaging
  • Increased from 30%-46% ophthalmologists
  • Increased from 26%-47% optometrists
  • Overall increase by 147%
  • By 2008, pts cared for by ODs were more likely to undergo imaging

than fields

  • Disc photography
  • Only 16% likelihood
  • ODs more likely to use photos
slide-3
SLIDE 3

2/6/2019 3 OCULAR HYPERTENSION TREATMENT STUDY

  • To compare the rates of detection of optic

disc hemorrhages by clinical examination and by review of optic disc photographs at the Optic Disc Reading Center

  • To assess the incidence of and the predictive

factors for disc hemorrhages

  • To determine whether optic disc

hemorrhages predict the development of primary open-angle glaucoma

OCULAR HYPERTENSION TREATMENT STUDY

  • Stereophotography-confirmed glaucomatous
  • ptic disc hemorrhages were detected in 128

eyes of 123 participants before the POAG end point

  • Twenty-one cases (16%) were detected by

both clinical examination and review of photographs, and 107 cases (84%) were detected only by review of photographs

OCULAR HYPERTENSION TREATMENT STUDY

  • Review of stereophotographs was more

sensitive at detecting optic disc hemorrhage than clinical examination.

slide-4
SLIDE 4

2/6/2019 4

IDENTIFYING GLAUCOMA PROGRESSION

  • Photographic comparisons
  • Not c/d ratio or written descriptions
  • Obtaining RNFL photographs with sufficient quality for

interpretation is difficult.

  • Visualizing RNFL defects can be obscured in eyes with

hypopigmented fundus and myopia in which background reflection is high and contrast is low.

  • Sustained decrease in imaging
  • Measuring rate of progression with OCT is not so difficult

and already is better than people recognize.

  • Sustained decrease in visual field
  • Look at photos and imaging for support
  • Look at rate of change
  • requires good baseline fields and then careful follow-up fields,

excluding inappropriate tests, none of which is easy. Baseline 5 years later

Missed the disc hemorrhage, didn’t you?

Baseline 5 years later

slide-5
SLIDE 5

2/6/2019 5

2003 2008

Yet another patient

  • 17 YOF- glaucoma suspect at age 10 based

upon disc appearance

  • Disc normal; OCT normal
  • Peak IOP: 19 mm OD, 17 mm OS (2010)
  • 14 mm OD, 17 mm OS (2017)
  • CCT 564 OU
  • 20/15 OD, OS
  • Color vision normal OU

Well, can’t I just use my OCT and be done with all this photo nonsense? ISSUES IN IMAGING

  • You cannot make a diagnosis of glaucoma

based solely upon imaging results.

  • The use and overemphasis of imaging

technology to the exclusion of additional clinical findings and assessment of risk will put patients in peril.

  • Exactly how much confidence should an OCT

give you as to whether or not a patient has glaucoma?

  • Depends how much confidence you had before you

imaged the patient.

29

ISSUES IN IMAGING

  • Normative Database
  • Signal Quality
  • Blink/Saccades
  • Segmentation Errors
  • Media Opacities
  • Axial Length

30

slide-6
SLIDE 6

2/6/2019 6

DISPARITY IN IMAGING AND EXAMINATION

  • Things have to make sense. If the imaging

findings to not fit with the anatomic and functional correlates of pathophysiologic change, trust your own knowledge and judgment.

  • When in doubt, repeat the imaging study and

the visual field or both.

RED DISEASE – A NEW CLINICAL NON-ENTITY

A supratentorial, non-glaucomatous masquerade disease Afflicts the educated patient (especially with Internet access) with good health care plans and/or wealth Debilitating to the patient and painful for the visual care provider to treat

  • 2005. Journal of Irreproducible Results and Senseless Studies

SCANNING LASER OPHTHALMOSCOPY EXAMPLE OF RED DISEASE

First Visit Follow up visit #1 Follow up visit #2

HRT3 Optic Nerve Head Changes How long did this change take?

WITHIN 15 MINUTES! HRT DISC SIZING ARTIFACT GREEN DISEASE– AN INSIDIOUS CLINICAL ENTITY

A glaucomatous process masquerading as non-disease Afflicts inexperienced, poorly-educated, and lazy doctors who simply want a machine to make all clinical decisions for them Debilitating to the patient and painful for the visual care provider, but a boon for malpractice attorneys

  • 2015. Journal of Irreproducible Results and Senseless Studies

HELP! THE DIAGNOSTIC IMAGING DOESN’T AGREE WITH MY DIAGNOSIS!

  • 56 YOM- Glaucoma suspect since 2012
slide-7
SLIDE 7

2/6/2019 7

Is this person really a glaucoma ‘suspect’? A example of Green Disease

Green Disease

Green Disease

BELIEVE YOUR OWN EYES

slide-8
SLIDE 8

2/6/2019 8

ASSESSING THE OPTIC DISC

  • Advantages:
  • Glaucoma is a primary optic nerve disease. Changes
  • ften occur here early and are clinically detectable.
  • No extra or expensive equipment needed
  • Still part of a comprehensive analysis
  • Disadvantages
  • Patient cooperation
  • Hemorrhages and RNFL defects are easily and often

missed.

  • Forget about the green filter

ASSESSING THE OPTIC DISC WITH PHOTOGRAPHY

  • Advantages:
  • Allows for careful inspection
  • Identifies RNFL defects and disc hemorrhages
  • Actually most sensitive detection method (OHTS)
  • Identifies optic disc pallor in comparison
  • Platform has been around for a long time
  • Ubiquitous in practice
  • No normative database
  • Complementary to OCT
  • Disadvantages
  • No normative database
  • Learned skill

ASSESSING THE OPTIC DISC WITH PHOTOGRAPHY

  • Optic disc photography has been around a long time
  • Personal skill makes this a technique with fewer ‘errors’
  • Allows you to see things missed by OCT and clinical

exam

  • The camera is your friend
  • Take photos…and actually look at them.

THE HIGH-TECH APPROACH: UTILIZING OCT IN GLAUCOMA MANAGEMENT

JESSICA STEEN OD

ANTERIOR SEGMENT OCT IN ANGLE ASSESSMENT

Cross-sectional view of the angle in a single plane Non-contact procedure May be performed in total darkness

LANDMARKS ON GONIOSCOPY

Trabecular meshwork Ciliary body Scleral spur

slide-9
SLIDE 9

2/6/2019 9

Trabecular meshwork Scleral spur Ciliary body

QUANTITATIVE EVALUATION

Trabecular-iris angle Angle opening distance

  • Leung. IOVS 2008

Where is the scleral spur?! What about the rest of the anterior chamber? Pigmentation? Recession? Neovascularization? BOTTOM LINE

  • Quantitative tools have a limited role in a clinical

environment

  • Adjunct to gonioscopy
  • AS OCT may be more likely to identify angle closure
  • May help to determine whether the angle open or closed

OCT: RNFL AND GCC ANALYSIS

  • Objective structural assessment
  • Used as an adjunct to clinical examination and

automated perimetry

  • Normative database provides comparative

information

RETINAL NERVE FIBER LAYER

  • VS. GANGLION CELL COMPLEX
  • Analysis of both are recommended
  • Ganglion cell complex (not just the cell layer)
  • Difficult to segment ganglion cell layer ONLY
  • Retinal ganglion cells most dense at the macula (more than 50%)
  • Lack of retinal blood vessels and support cells
  • Retinal nerve fiber layer contains non-neuronal elements
  • Thickness impacted by blood vessels, glial elements
  • BUT-contains all retinal ganglion cell axons
slide-10
SLIDE 10

2/6/2019 10

NORMATIVE DATABASES

  • Cirrus
  • 284 eyes; 6 US sites, 1 China
  • 19-84 years of age
  • RT-Vue
  • 600 eyes: 11 worldwide sites-USA, Japan, India, England
  • 19-84 years of age
  • Spectralis
  • 201 patients; 1 site in Germany
  • Caucasian population
  • 18-78 years of age

ERRORS IN ACQUISITION AND INTERPRETATION

  • Incorrect definition of boundaries on OCT
  • Segmentation error
  • Red vs. green disease
  • Up to 1/3 of OCT images contain some form of artifact
  • Floor effect

GREEN DISEASE

Fondly referred to as an essentially normal RNFL and GCC with

  • ptic disc and functional abnormality

GREEN DISEASE

  • 63 year old black male
  • Angle recession glaucoma diagnosed in 2002
  • Blunt trauma OD with baseball bat
  • Tmax
  • 37/14mmHg
  • Travatan Z QHS OD
  • IOP last visit 18/13mmHg
  • 1+ APD OD

RED DISEASE

Normal GCC Parameters

slide-11
SLIDE 11

2/6/2019 11

OPTIC DISC SIZE

Knight, Girkin, Budenz. Arch Ophthalmol 2012

SMALL <1.58mm2 MED 1.58- 1.88mm2 LARGE >1.88mm2

RT-Vue African descent mean 2.10mm2

3.53mm2 OD 4.24mm2 OS

OCT AND GLAUCOMA MANAGEMENT

  • Early disease
  • Relatively thick retinal nerve fiber layer; (only) structural

change

  • Moderate disease (RNFL 75-90 μm)
  • Structural and functional change
  • Advanced disease (RNFL <40-60 μm)
  • Functional change only
  • Another way:
  • Once there is field loss, structure and function may

change together

IS THERE ONLY STRUCTURAL CHANGE IN EARLY DISEASE?

  • Progressive RNFL thinning without visual field defect
  • Four YEAR lead time (Weinreb 2012)
  • This is not the case in all patients
  • Some patients may have early functional change without

significant structural change

  • Others have structural and functional change
slide-12
SLIDE 12

2/6/2019 12

OCT ANGIOGRAPHY

  • Imaging strategy that provides en face flow information
  • The only thing that moves in the retina over time are red

blood cells

  • Take the difference between multiple B scans at the same

location over time to produce a ‘decorrelation signal’

  • Not a replacement for FA/OCT
  • Provides new information

CLINICAL USES OF OCTA

  • Driving force has been retinal

disease

  • Choroidal neovascularization
  • Retinal vascular disease
  • Diabetic retinopathy
  • Microaneurysms
  • Macular ischemia
  • Retinal neovascularization
  • Non exudative lesions in eyes with

intermediate AMD

CLINICAL USES OF OCTA

  • Neurological disease
  • Alzheimer’s disease
  • Parkinson’s disease
  • Multiple sclerosis
  • Optic nerve disease
  • Glaucoma
  • Focus on OAG

GLAUCOMA AND MICROVASCULATURE ON OCTA

  • Both vascular and mechanical

factors play a role in pathophysiology of POAG

  • Microvascular dysregulation
  • Decreased optic disc perfusion
  • Radial peripapillary capillaries

supply retinal ganglion cell axons

  • RGC axons (RNFL) are selectively

damaged

WHERE DO WE LOOK FOR GLAUCOMATOUS DAMAGE ON OCTA?

  • Radial peripapillary capillary

plexus

  • Parafoveal superficial capillary

plexus

Superficial vascular plexus (NFL and GCL)

OCT ANGIOGRAPHY IN GLAUCOMA

Reduced peripapillary perfusion with decreased vascular density Best observed in superficial capillary plexus

slide-13
SLIDE 13

2/6/2019 13

OCTA IN GLAUCOMA

  • May aid in the detection and progression of glaucoma
  • Especially in combination with other OCT parameters

(RNFL thickness, GCC measurements)

  • Especially helpful in anomalous optic discs which impact

RNFL measurements

  • May allow for progression detection below the typically

‘floor effect’ seen in RNFL and GCC analysis

FLOOR EFFECT

  • When RNFL reaches approximately 50μm, even with further

disease progression, thickness measurement will not change

  • Blood vessels and glial support cells
  • OCTA may allow for objective assessment of progression

below typical ‘floor’ of GCC and pRNFL on SDOCT

QUANTITATIVE ANALYSIS

Hollo, G. Turk J Ophthalmol. 2018

WHAT ABOUT PARAFOVEAL MICROVASCULATURE?

  • Retinal ganglion cells have high metabolic demand
  • Highly concentrated in the macula
  • Retinal (superficial) capillary plexus covers high metabolic

need

Jia Y , Morrison JC, Huang D. Casey Eye Institute

slide-14
SLIDE 14

2/6/2019 14

WHAT HAPPENS FIRST?

  • Glaucomatous eyes have reduced ocular blood

flow

  • Does decreased ocular blood flow cause optic

neuropathy--or does optic disc damage cause decreased blood flow?

  • A) Ischemia leads to ganglion cell death
  • B) GC loss results in reduced metabolic demand

CHALLENGES OF INTERPRETATION

  • Development of normative database
  • OCTA results are not specific for any disease
  • Systemic disease impacts vessel density on OCTA
  • Diabetes mellitus
  • Hypertension
  • Medication use
  • Do IOP lowering medications impact vascular parameters?
  • Topical phenylephrine used for dilation prior to imaging?

CHALLENGES OF INTERPRETATION

  • Image acquisition
  • Gaze-tracking software improves motion artifacts
  • Difficulty fixating in advanced disease
  • Visually significant cataract reduces image quality
  • Small field of view gives greatest resolution (3x3mm,

6x6mm)

FINAL IMAGING PEARLS

  • Always scan both eyes
  • If there’s something unexpected:
  • Re-scan
  • (Use a different device)
  • Watch the scan being performed

THE TIPPING POINT

  • Ultimate goal is earlier identification of pathology
  • But what do we do with that information?
  • Earlier medical treatment?
  • Increased cost of healthcare
  • Earlier failure of medications?
  • Incisional surgical intervention
  • How does this impact QOL?
  • Does earlier treatment reduce

functional disability?

BOTTOM LINE

  • The way we detect disease is changing
  • In general, OCT allows earlier detection of disease
  • No “gold standard” to definitively determine who is

getting worse

  • Correlate clinical and anatomical findings with

imaging results

slide-15
SLIDE 15

2/6/2019 15

BRINGING LOVE BACK TO THE VISUAL FIELD NORMAL VISUAL FIELD PARAMETERS

  • 60° superior
  • 60° nasal
  • 75° inferior
  • 100° temporal
  • Macula the central 13°
  • Fovea the central 3°
  • Visual field is limited by the size of the retina

and margins of the orbit

PEARLS ON STATIC VISUAL FIELDS

  • Most visual fields test 0-51 decibels
  • 41-51 decibels is outside human vision
  • 1 diopter of refractive blur in undilated patient
  • A little more than 1 decibel of depression of the hill of vision
  • With Goldmann III stimulus
  • Leave cylindrical errors of less than 2 diopters uncorrected
  • Adjusted with spherical equivalent
  • Above 2 diopters correct the astigmatism with trial lens
  • Background of a visual field illuminated (31.5 apostilbs)
  • Minimum brightness for photopic or daylight
  • Cones are isolated, test photopic system
  • More on contrast, less on absolute brightness
  • Changes in pupil size, crystalline lens color and transparency have less effect on

result

STATIC PERIMETRY IN EYE CARE

  • Neurological disease
  • Retinal disease
  • Glaucoma
  • Perimetry is essential in diagnosis and management
  • Why test the central 24-30 degrees?
  • Only a small percentage of glaucomatous defects occur in the

peripheral visual field alone

  • Testing the central 24-30-degree field is preferred in glaucoma

management

  • Most of the retinal ganglion cells are within the 30 degrees of fixation

24-2 versus 30-2 Static Visual Field

  • 30-2 tests 76 locations
  • 24-2 tests 54 locations
  • Tests 30 degrees nasal
  • Little diagnostic information lost in 24-2
  • Time is saved
  • Fewer trial lens and lid artifacts
  • 24-2 has become the VF for glaucoma
  • Only down side, 30-2 can sometimes find progression earlier due to

more test points

SAP AND SITA

  • SAP- Standard Automated Perimetry
  • Determines the threshold (how dim of light) can be seen at various points
  • Various algorithms have been developed to determine this threshold using

few to numerous individual points in a single visual field test

  • SITA-Swedish Interactive Thresholding Algorithm
  • Optimizes the determination of perimetry thresholds
  • Continuously estimating what the expected threshold is based on the

patient's age and neighboring thresholds

  • Reduce the time necessary to acquire a visual field by up to 50%.
  • Decreases patient fatigue and increases reliability
  • SITA mode is now widely used in many computerized automated

perimeters

  • SITA- can be applied to:
  • SAP- Standard Automated Perimetry
  • SWAP-Short Wavelength Automated Perimetry (SWAP)
slide-16
SLIDE 16

2/6/2019 16

Sita Standard versus Sita Fast SITA FASTER

  • Turns off False Negatives
  • Turns off Blind Spot monitor
  • Leaves on False Positives
  • Leaves on Gaze Tracking
  • Faster test with same reliability

SITA FASTER FOVEAL THRESHOLD

FOVEA “ON” VERSUS “OFF”

  • Instrument can do 51 db
  • Perfect macula and perimetrically trained young person = 40 db
  • Visual acuity and foveal threshold should correlate
  • Each validate each other
  • Visual acuity is good and threshold is low
  • Possible early damage to fovea
  • Glaucoma
  • Plaquenil toxicity
  • 47% of patients with 20/20 had threshold better than 37db 1
  • This method may be useful to predict visual acuity in eyes with possible

nonorganic visual acuity loss.

1 Flaxel CJ1, Samples JR, Dustin L., Relationship between foveal threshold and visual acuity using the Humphrey visual field analyzer. Am J Ophthalmol. 2007 May;143(5):875-7. Epub 2007 Jan 2

SHORT WAVELENGTH AUTOMATED PERIMETRY (SWAP)

  • Blue-yellow perimetry
  • Goldmann V stimuli on yellow background
  • Thought to detect glaucomatous defect earlier than white
  • n white
  • Due to Sita standard strategy can find defect as early

GLAUCOMA VISUAL FIELD

  • Need a current refraction
  • Cataracts cause refractive shifts
  • 24-2
  • Sita-Standard (not fast)
  • Fovea “on”
  • Sita Faster on the experienced VF test taker
slide-17
SLIDE 17

2/6/2019 17

INTERPRETING VISUAL FIELDS

  • No longer reliable or unreliable
  • A continuum from highly reliable to marginally informative
  • False positives
  • More destructive to interpretation than formerly believed
  • False negatives
  • Expected to be abnormal in a glaucomatous visual field
  • Even in attentive tester
  • Gaze tracker
  • Typically a better indicator than blind spot
  • Progression is not present or absent
  • Is the rate of change acceptable

5 DECIBEL LOSS

  • Read slower
  • Don’t leave home as much
  • Walk slower
  • Increase in car accidents

INTERPRETING VISUAL FIELDS

  • Diagnosis
  • Probability Plots
  • Glaucoma Hemifield Test
  • Staging and following over time
  • Mean Deviation
  • Visual Field Index

PROBABILITY PLOTS TOTAL DEVIATION TO PATTERN DEVIATION

WHAT WE EXPECT- RAISES THE HILL OF VISION

PROBABILITY PLOTS TOTAL DEVIATION TO PATTERN DEVIATION NOW WHAT HAPPENED?

PROBABILITY PLOT BUTTERFLY/CLOVERLEAF THE PATIENT IS ZONING OUT

slide-18
SLIDE 18

2/6/2019 18

MD AND PSD

MD MD 54 spots on 24-2

All 54 spots reduced by 1 DB (54DB) MD 1DB

54 spots s on 24-2

27 spots reduced by 2 DB (54 DB) MD 1 DB

54 spots on 24-2

13.5 spots reduced by 4 DB (54DB) MD 1 DB

PSD Low PSD (Gener eralized zed loss)

1.00 DB

Moder erate e PSD (More e localized zed loss)

3.00 DB

High h PSD (Localized zed loss)

5.00 DB

VISUAL FIELD INDEX-VFI

  • Part of the visual field indices
  • MD, PSD, and VFI
  • Mean Deviation- zero indicates, no

deviation

  • “How deep” is the defect (or elevated)
  • Pattern Standard Deviation
  • “How localized” is the defect
  • Visual Field Index
  • Enhanced Mean Deviation
  • Designed to be less affected by cataracts
  • More sensitive to changes in the center of

the visual field

  • Better correlates with ganglion cell loss
  • Normal 100%
  • Perimetric blindness 0%
  • VFI and MD helpful in:
  • Staging
  • Following over time

THOUGHTS ON MEAN DEVIATION (MD)

What is the Mean an Deviat iatio ion on a visual ual field of a blin ind eye?

HVF-3 THOUGHTS ON MEAN DEVIATION (MD)

Turn on your VF let it run

  • 30 DB (decibel)

0-5 5 (1/6) 30% reduction 5-10 10 (1/3) 40% reduction >10 (1/2) 50% reduction How many DB differ eren ence e to reliable e VF should cause e a RAPD?

  • 3 DB for a small APD, the larger the difference the greater the APD

Diagnosis Probability Plots Glaucoma Hemifield Test Staging and following over time Mean Deviation Visual Field Index

65 YO WOMAN, IOPS TMAX 24/24, PACHS 585/588

slide-19
SLIDE 19

2/6/2019 19

65 YO WOMAN, IOPS TMAX 24/24, PACHS 585/588

54 YO WOMAN WITH POAG 54 YO WOMAN WITH POAG

59 YO MAN, SEVERE POAG (OVER 4.5 YEARS) 59 YO MAN, SEVERE POAG (OVER 4.5 YEARS) 59 YO MAN, SEVERE POAG (OVER 4.5 YEARS)

slide-20
SLIDE 20

2/6/2019 20

STRUCTURE VERSUS FUNCTION DEBATE

48 YO MAN TMAX 36/38 STRONG FAMILY HISTORY OF POAG

STRUCTURE AND FUNCTION

STRUCTURE (OKAY) AND FUNCTION

AT 48 YO I WILL TAKE MY GLAUCOMA SERIOUS

TMAX AT DIAGNOSIS 26/32 POOR COMPLIANCE FROM 44-48 YO

51 YO STAYING COMPLIANT 51 YO STAYING COMPLIANT

slide-21
SLIDE 21

2/6/2019 21

69 YO MAN WITH POAG

BE CAREFUL OD VF LOOKS RELIABLE WITH FL, FP,FN, AND GAZE MONITOR 69 YO- BE CAREFUL EVEN THE VF SAYS RELIABLE

69 YO- BE CAREFUL EVEN THE VF SAY RELIABLE