SLIDE 1 Vis is10 101 - Vi
Visu sual aliz izat atio ion
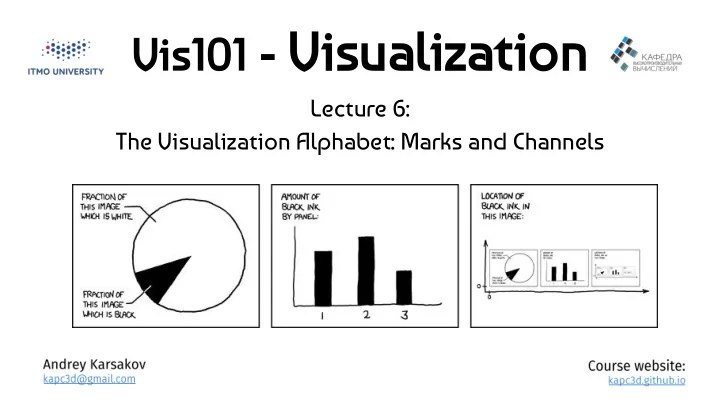
Lecture 6: The Visualization Alphabet: Marks and Channels
SLIDE 2 This Week
Homework 1! Lecture 5: Lecture 6: Section 2: Reading:
SLIDE 3
No Device Policy
SLIDE 4
Last Week
SLIDE 5 Terms
Dataset Types Data Types
SLIDE 6 Tables
Flat Table Multidimensional Table
Keys Attributes Item Values
SLIDE 7 Multidimensional Tables
z
Keys: Genes Keys: Patients
SLIDE 8
Graphs/Networks
SLIDE 9 Fields
Attribute values associated with cells Cell contains data from continuous domain Measured or simulated Sampling & Interpolation
SLIDE 10 Other Collections
Sets Lists Clusters
SLIDE 11 Data Types
Nominal (labels) Ordinal (ordered) Interval (location of zero arbitrary) Ratio (zero fixed)
On the theory of scales and measurements [S. Stevens, 46]
SLIDE 12 Item/Element/ (Independent) Variable
SLIDE 13 Attribute/ Dimension/ (Dependent) Variable/ Feature
SLIDE 16 Attribute Types?
SLIDE 17 Categorical Ordinal Quantitative
SLIDE 18
Design Critique
SLIDE 19
Recalled Cars NY Times
http://goo.gl/tDVISB
SLIDE 20
The Visualization Alphabet: Marks and Channels
SLIDE 21
SLIDE 22
Marks & Channels
SLIDE 23
Example: Homework 2
SLIDE 24
Marks for Items
SLIDE 25
Marks for Links
SLIDE 26
Containment can be nested
SLIDE 27
Channels (aka Visual Variables)
SLIDE 28
Jacques Bertin
SLIDE 29
Bertin’s Visual Variables
SLIDE 30
Using Marks and Channels
SLIDE 31
Redundant encoding
SLIDE 32
Good bar chart?
SLIDE 33
Types of Channels
SLIDE 34 Channels: Expressiveness Types and Effectiveness Ranks
SLIDE 35
What visual variables are used?
SLIDE 36
What visual variables are used?
SLIDE 37
Characteristics of Channels
Selective Associative Quantitative (Magnitude vs Identity Channels)
SLIDE 38
Characteristics of Channels
Order (Magnitude vs Identity) Length
SLIDE 39
Position
Strongest visual variable Suitable for all data types Problems:
SLIDE 40
Example: Scatterplot
SLIDE 41
Position in 3D?
SLIDE 42
Length & Size
Good for 1D, OK for 2D, Bad for 3D Easy to see whether one is bigger Aligned bars use position redundantly
SLIDE 43
Example 2D Size: Bubbles
SLIDE 44
Value/Luminance/Saturation
OK for quantitative data when length & size are used. Not very many shades recognizable
SLIDE 45
Example: Diverging Value-Scale
SLIDE 46 Color
Good for qualitative data (identity channel) Limited number of classes/length (~7-10!) Does not work for quantitative data! Lots of pitfalls! Be careful! Suggested rule:
SLIDE 47
Color: Bad Example
SLIDE 48
Color: Good Example
SLIDE 49
Shape
Great to recognize many classes. No grouping, ordering.
SLIDE 50
SLIDE 51
Chernoff Faces
Idea: use facial parameters to map quantitative data
SLIDE 52
More Channels
SLIDE 53
Why are quantitative channels different?
SLIDE 54
Steven’s Power Law, 1961
SLIDE 55
How much longer?
SLIDE 56
How much longer?
SLIDE 57
How much steeper?
SLIDE 58
How much larger (area)?
SLIDE 59
How much larger (area)?
SLIDE 60
How much larger (diameter)?
SLIDE 61
How much darker?
SLIDE 62
Position, Length & Angle
SLIDE 63
Other Factors Affecting Accuracy
SLIDE 64
Cleveland / McGill, 1984
SLIDE 65
Heer & Bostock, 2010
SLIDE 66
SLIDE 67
Jock Mackinlay, 1986
SLIDE 68 Channels: Expressiveness Types and Effectiveness Ranks
SLIDE 69 Next Week
Lecture 7: Lecture 8: Section 3: Homework 1 due to Friday, 30 October.