
SLIDE 1
IIT Bombay
CE 303 8 Instructor: AJ
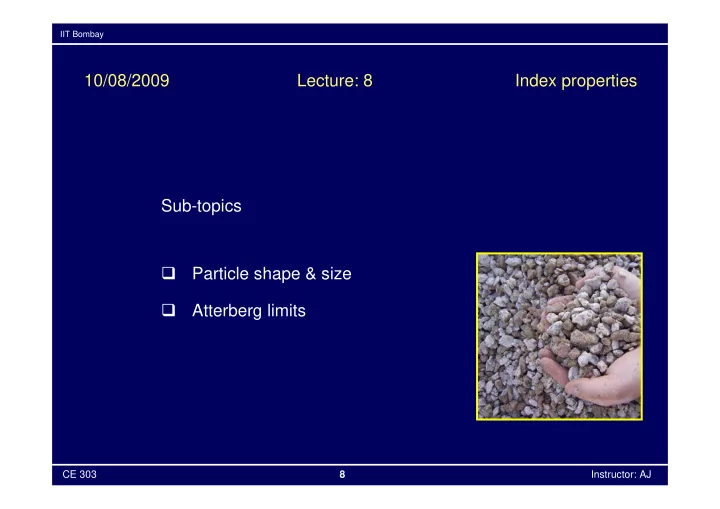
10/08/2009 Lecture: 8 Index properties Sub-topics
- Particle shape & size
- Atterberg limits
10/08/2009 Lecture: 8 Index properties Sub-topics Particle - - PowerPoint PPT Presentation
IIT Bombay 10/08/2009 Lecture: 8 Index properties Sub-topics Particle shape & size Atterberg limits CE 303 8 Instructor: AJ IIT Bombay CE 303 8 Instructor: AJ IIT Bombay Particle size distribution curves Classification
IIT Bombay
IIT Bombay
IIT Bombay
IIT Bombay
IIT Bombay
IIT Bombay
IIT Bombay
IIT Bombay
IIT Bombay
IIT Bombay
IIT Bombay
IIT Bombay
Weight
IIT Bombay
IIT Bombay
IIT Bombay
IIT Bombay
IIT Bombay
IIT Bombay