SLIDE 1
1
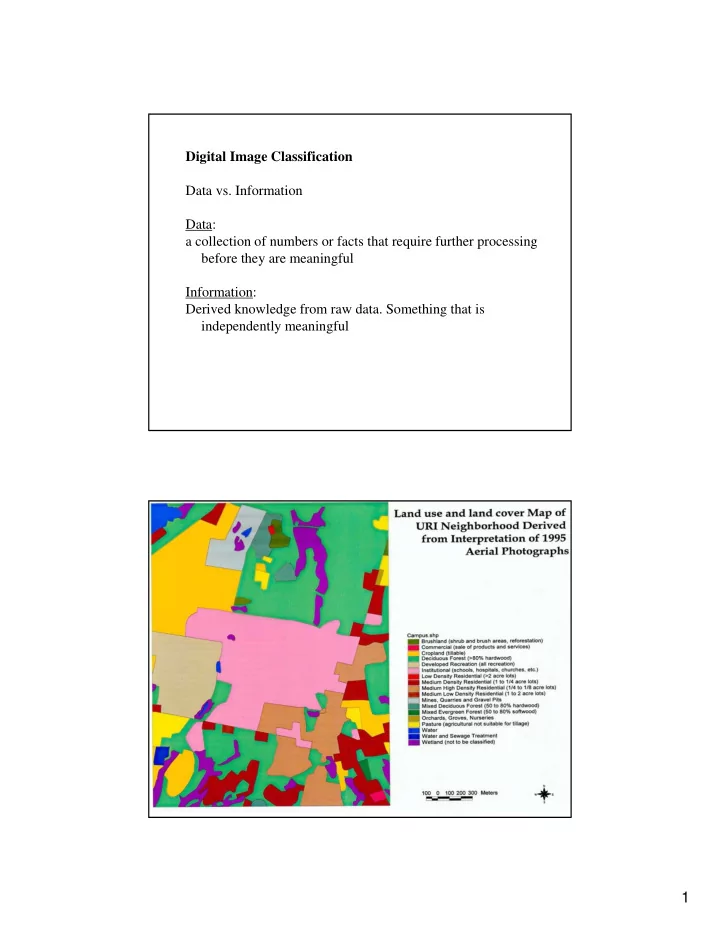
Digital Image Classification Data vs. Information Data: a collection of numbers or facts that require further processing before they are meaningful Information: Derived knowledge from raw data. Something that is independently meaningful
SLIDE 2
2
Information Classes vs. Spectral Classes Information classes are the categories of interest to the users of the data, e.g., forest types, wetlands categories, agricultural fields, urban land use, … These classes form the information that we hope to derive from remote sensing data. These classes are not directly recorded on remote sensing images. We can derive them only indirectly, using the evidence contained in brightness recorded by each band of remote sensing image. Spectral classes are groups of pixels that are uniform with respect to the brightness in their spectral channels. The links between spectral classes and the information classes are the primary goal of image classification
SLIDE 3
3
Multispectral Classification is the process of sorting pixels into a finite number of individual classes, or categories of data, based on their data file values. If a pixel satisfies a certain set of criteria, the pixel is assigned to the class that corresponds to that criteria. Pattern Recognition is the science and art of finding meaningful patterns in data, which can be extracted through classification.
SLIDE 4
4
PDF File downloadable at USGS website
SLIDE 5
5
SLIDE 6 6
The C-CAP Coastal Land Cover Classification System includes three Level I super classes of 1. Upland; 2. Wetland; and 3. Water and Submerged Land. These super classes are subdivided into classes and subclasses at Levels II and III, respectively. While the latter two categories constitute the primary habitats of interest to NOAA, uplands are also included because they influence adjacent wetlands and water bodies. The classification system is hierarchical, reflects ecological relationships, and focuses on land cover classes that can be discriminated primarily from satellite remote sensor data. It was adapted and designed to be compatible with other nationally standardized classification systems, especially:
- 1. The U.S. Geological Survey's "Land Use/Land Cover Classification System
For Use with Remote Sensor Data" (Anderson et al. 1976; USGS 1992;
- 2. The U.S. Fish and Wildlife Service's "Classification of Wetlands and
Deepwater Habitats of the United States"
- 3. The Environmental Protection Agency's Environmental Monitoring and
Assessment Program (EMAP) classification system.
SLIDE 7
7
The Land Cover Classification System (LCCS) is a comprehensive, standardized a priori classification system, designed to meet specific user requirements, and created for mapping exercises, independent of the scale or means used to map. Any land cover identified anywhere in the world can be readily accommodated.
SLIDE 8
8
SLIDE 9
9
Classification systems have been developed to address specific mapping needs. Classification systems provide the guidelines for digital image classifications.
Fresh Water Ocean Water Wetland Urban Deciduous Forest Agriculture Coniferous Forest
SLIDE 10
10
For example, differences between vegetation classes are often more distinct in the near infrared than visible spectrum.
SLIDE 11
11
Spatial Resolution (Pixel size) Spectral Resolution (Bands)
23 42 89 94 Spectral band 1 2 3 4
SLIDE 12 12
Unsupervised Classification Requires only a minimal amount of initial input from the
- analyst. However, the analyst will have the task of
interpreting the classes that are created by the unsupervised training algorithm. Unsupervised classification is a process of numerical
- perations that search for natural groupings of the spectral
properties of pixels, as examined in multispectral feature
- space. It is also called clustering.
ISODATA (Iterative Self-Organizing Data Analysis Technique) Makes a large number of passes through the remote sensing dataset until specified results are obtained. It requires the analyst to specify:
- 1. the maximum number of clusters to be identified by the
algorithm.
- 2. the maximum percentage of pixels whose class values are
allowed to be unchanged between iterations. When this number is reached (e.g., 95%), the algorithm terminates.
SLIDE 13 13
Isodata Clustering Advantage Disadvantage
- Clustering is not geographically biased to
the top or bottom pixels of the data file, because it is iterative.
- It is highly successful at finding the
spectral clusters that are inherent in the data.
- A preliminary thematic raster layer is
created, which gives results similar to using a minimum distance classifier on supervised classification.
- this data layer can be used for analyzing
and manipulating the signatures before actual classification takes place. Does not account for pixel spatial homogeneity.
SLIDE 14
14
Supervised Classification Supervised classification is more closely controlled by analyst than unsupervised classification. In this process, the analyst select pixels that represent patterns recognized and identify the pixels as training signatures. By the training signatures, the computer system can be “trained” to identify pixels with similar characteristics. Training is the process of defining the criteria by which patterns in image data are recognized for the purpose of classification Training Sample (Signature) A set of pixels selected to represent a potential class. Supervised Training Any methods of generating signatures for classification, in which the analyst is directly involved in pattern recognition process.
SLIDE 15 15
Non-Parametric Rules:
- 1. Parallelepiped
- 2. Feature Space
Parametric Rules
- 1. Minimum distance
- 2. Mahalanobis distance
- 3. Maximum likelihood (with Bayesian variation)
Parallelepiped Decision Rule The data file values of the candidate pixels are compared to upper and lower limits. These limits can be either:
- 1. The minimum and maximum data file values of each band in the signature
- 2. The mean of each band, plus and minus a number of standard deviations, or
- 3. Any limits that user defines based on the user’s evaluation of the data file.
SLIDE 16 16
Overlap Region In cases where a pixel value may fall into the overlap region
- f two or more parallelepipeds, the user must define how the
pixel will be classified.
- The pixel can be classified by the order of the signatures.
If one of the signatures is first and the other signature is fourth, the pixel will be assigned to the first signature’s
- class. This order can be set in the Signature Editor.
- The pixel can be classified by the defined parametric
decision rule. The pixel will be tested against the
- verlapping signatures only. If neither of these signatures
is parametric, then the pixel will be left unclassified. If
- nly one of the signatures is parametric, then the pixel will
be assigned automatically to that signature’s class.
- The pixel can be left unclassified.
Regions Outside of the Boundaries If the pixel does not fall into one of the parallelepipeds, then the user must define how the pixel will be classified.
- The pixel can be classified by the defined parametric
decision rule. The pixel will be tested against all of the parametric signatures. If none of the signatures is parametric, then the pixel will be left unclassified.
- The pixel can be left unclassified.
SLIDE 17 17
Parallelepiped Decision Rule Advantage Disadvantage
- Fast and simple, since the data file
values are compared to limits that remain constant for each band in each signature.
- Often useful for a first-pass, broad
classification, which narrow down the number of possible classes before more time-consuming process starts.
distributions. Since parallelepipeds have “corners,” pixels that are actually quite far, “spectrally” from the mean of the signature may be classified.
Minimum Distance Rule (Spectral Distance): This decision rule calculates the spectral distance between measurement vector from the candidate pixel and the mean vector for each signature.
SLIDE 18 18
Minimum Distance Decision Rule Advantage Disadvantage
- Since every pixel is spectral closer
to either one sample mean or another, there are no unclassified pixels.
- a fast decision rule in computing.
Does not consider class variability. For example, a class like an urban land cover class is made up of pixels with high variance, which may tend to be farther from the mean of the
- signature. Using this decision rule,
- utlying urban pixels may be
improperly classified. Inversely, a class with less variance, e.g., water, may tend to over classify (i.e., classify more pixels than are appropriate to the class.
Maximum Likelihood Decision Rule (Bayesian Classifier) The maximum likelihood decision rule assumes that the histograms
- f the bands of data have normal distributions. It is based on the
probability that a pixel belongs to a particular class. The basic equation assumes that these probabilities are equal for all classes. If the user has a priori knowledge that the probability are not equal for all classes, the weight factors can be employed to improve the classification.
Mean STD
SLIDE 19 19
Maximum Likelihood/Bayesian Decision Rule Advantage Disadvantage
- The most accurate of the classifiers
for the pixel values that have a normal distribution, because it takes the most variables into consideration
- Takes the variability of classes into
account by using the covariance. Maximum likelihood is parametric, meaning that it relies heavily on a normal distribution of the data in each input band. Tends to over classify signatures with relatively large values in the covariance matrix. If there is a large dispersion of the pixels in a cluster or training dispersion, then the covariance matrix of that signature will contain large values.