SLIDE 1
TSX:NWI
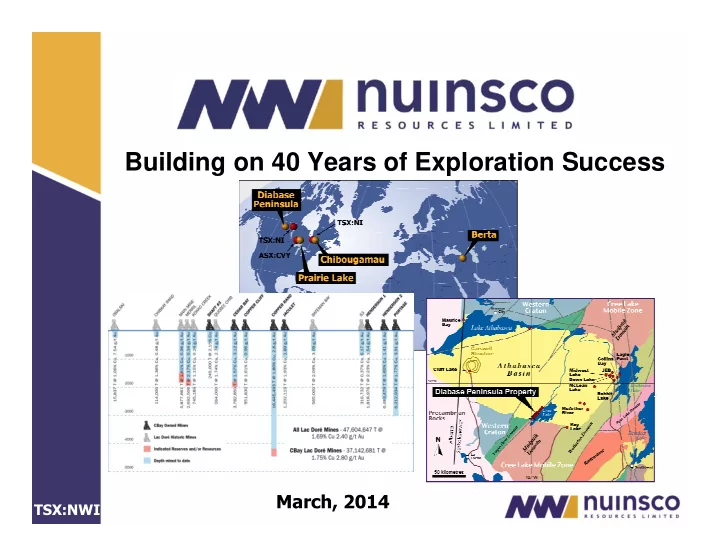
Building on 40 Years of Exploration Success
March, 2014
SLIDE 2 TSX:NWI
2
This document contains forward-looking information. All statements, other than statements of historical fact, that address activities, events or developments that the Company believes, expects or anticipates will or may occur in the future constitute forward-looking information. This forward-looking information reflects the current expectations or beliefs of the Company based on information currently available to the Company. Forward-looking information is subject to a number of risks and uncertainties that may cause the actual results of the Company to differ materially from those discussed in the forward-looking information, and even if such actual results are realized or substantially realized, there can be no assurance that they will have the expected consequences to, or effects on the Company. Factors that could cause actual results or events to differ materially from current expectations include, among other things: the possibility that actual circumstances will differ from estimates and assumptions; uncertainties relating to the availability and costs of financing needed in the future; failure to establish estimated mineral resources; fluctuations in commodity prices and currency exchange rates; inflation; recoveries being less than those indicated by the testwork carried out to date (there can be no assurance that recoveries in small scale laboratory tests will be duplicated in large tests under on-site conditions or during production); changes in equity markets; operating performance of facilities; environmental and safety risks; delays in
- btaining or failure to obtain necessary permits and approvals from government authorities; unavailability of plant,
equipment or labour; inability to retain key management and personnel; changes to regulations or policies affecting the Company’s activities; the uncertainties involved in interpreting geological data; and the other risks disclosed under the heading “Risk Factors” and elsewhere in the Company’s annual information form dated March 30, 2012 filed on SEDAR at www.sedar.com. Forward-looking information speaks only as of the date on which it is made and, except as may be required by applicable securities laws, the Company disclaims any intent or obligation to update any forward-looking information, whether as a result of new information, future events or results or otherwise. Although the Company believes that the assumptions inherent in the forward-looking information are reasonable, forward-looking information is not a guarantee of future performance and accordingly undue reliance should not be put on such information due to the inherent uncertainty therein.
Disclaimers
SLIDE 3
TSX:NWI
3
Nuinsco Resources Limited - Overview
One of Canada’s most experienced mineral exploration
companies
Over 40 years of exploration success, management continuity Track record of releasing value Current variety of assets capable of creating value at the
appropriate time
Solid treasury offers opportunities in current difficult market
SLIDE 4
TSX:NWI
4
NWI: Exploration Success & Value Creation
TSX Symbol NWI Shares Outstanding 295 million Fully Diluted 335 million Recent Share Price C$0.035 Market Cap $10 million
SLIDE 5 TSX:NWI
5
- 1. Solid balance sheet: $4.5 million working capital @ Sept. 30
- Strong competitive position in current market
- NWI is an active explorer compared with peers
- 2. Chibougamau Assets:
- Exploration by Nuinsco, new discoveries
- Addition of new advanced-stage assets in camp
- Structure and financing of CBay assets
- Ultimately: mill refurbishment, mine
development, copper/gold production
- 3. Xstrata drilling at Berta
- 4. Prairie Lake rare metals – metallurgy, resource estimate
- 5. Diabase Peninsula uranium
- 6. Evaluating near-term cash generating assets to minimize
equity dilution
Nuinsco Resources Limited
Value Drivers
SLIDE 6 TSX:NWI
6
100% owned, easily accessible, near
Marathon and Terrace Bay, Ont.
Carbonatite complex with phosphorus,
niobium, tantalum, uranium, REEs and
- thers with industrial applications
Second largest carbonatite-hosted
niobium deposit by tonnage in North America (#1: Iron Hill Project in Colorado) and one of world’s top 10
NI 43-101-compliant ETMI: 515-630
million tonnes @ 3.0% to 4.0% P2O5 and 0.09% to 0.11% Nb2O5 (0.9-1.1 kg/tonne) using only shallow drilling
- ver 12% of complex surface area
Flotation has produced a concentrate
grading in excess of 30% P2O5
Additional metallurgy, upgrading to
resource still to come
Prairie Lake Rare Metals Project
SLIDE 7
TSX:NWI
7
Prairie Lake Hill Looking East
Prairie Lake Rare Metals Project
SLIDE 8
TSX:NWI
8
Saskatchewan contains 65% of known
capacity for global uranium
Unconformity uranium deposits are
extremely profitable mining operations
11 deposits contain 1,670 million lbs
U308 with an average grade of 11.8%
Diabase Peninsula Uranium Project
SLIDE 9
TSX:NWI
9
Diabase Peninsula Uranium Project
All the right signals
100% interest, royalty-free, $9 million spent to date 42 drill holes (17,356m), airborne & ground geophysics,
geochemical surveys, mapping 22,000 Ha property
Identified all indicators for a uranium deposit in the Athabasca
basin: step-up in unconformity; faulting; graphite; strongly anomalous uranium, as well as arsenic, nickel, cobalt and base metals; clay alteration; boron anomaly in the sandstone
Next steps: Further drilling to find the deposit
SLIDE 10
TSX:NWI
10
Turkey: Berta
Exceptional and Diverse Mineral Potential
Diverse geology provides fertile terrane for exploration and discovery
Berta porphyry JV with Xstrata (35% NWI, 65% Xstrata): target is the largest copper anomaly, >15 km3, in the Turkish Pontides All holes drilled to date have intersected copper mineralization Extraordinarily anomalous copper obtained in 2007 drilling: 710 m of 0.28% Cu, 0.07 g/t Au 2012 drilling program continues to provide prospective, widespread, anomalous results, e.g. 354.6m of 0.14% Cu
SLIDE 11
TSX:NWI
Revitalizing the Chibougamau Mining Camp
Nuinsco (TSX:NWI) and Ocean Partners Subsidiary
11
SLIDE 12
TSX:NWI
12
Nuinsco helps to restructure Campbell Resources Ocean Partners (“OP”) provides funding to Campbell for Cu offtake Campbell upgrades Copper Rand Mine, adds production from Merrill Island pit, begins development of Corner Bay 2008 world financial crisis forces Campbell into CCAA protection
Chibougamau Nuinsco/OP History
Nuinsco/OP become sole secured creditors of all Campbell assets 2011: Nuinsco and OP get 50:50 joint ownership of Chibougamau assets, CBay Minerals created CBay implements services contract with Nuinsco to provide exploration, marketing, finance, administration
SLIDE 13 TSX:NWI
13
CBay Minerals – Steps to Value Realization
Overall objectives: Develop sufficient resources to feed permitted mill, possibly including custom milling Put mill and Corner Bay mine into production one year after financing Have three mines in production by 2016 Systematically explore to evaluate camp’s full potential for new discoveries Create employment and growth in Chibougamau
3,000 TPD Copper Rand Mill Corner Bay Mine
SLIDE 14 TSX:NWI
14
Chibougamau is a significant
Quebec mining camp with copper and gold production dating back to the early 1900s.
Lac Doré Complex has
produced 47.6 million tons ore containing 1.6 billion pounds
- f copper and 3.2 million
- unces of gold (75% from
CBay assets)
Chibougamau Mining Camp and CBay
Historical grades - 1.75% Cu, 2.5 g/t Au CBay is owned equally by Nuinsco and Ocean Partners, a
private metals trading entity
Total investment by Nuinsco and OP to date: $ 33.0 million CBay’s dominant asset position provides an excellent vehicle
for revival of the Chibougamau region.
SLIDE 15 TSX:NWI
15
Chibougamau – CBay Production Assets
Eight past producing copper/gold mines: Copper Rand Cedar Bay Jaculet Portage Henderson I Henderson II Mine Shaft #3 Copper Cliff Partially developed high-grade Corner Bay copper project Perch River advanced-stage copper project Segmented 3,000 TPD mill (four ball mills) and permitted tailings facility at Copper Rand All of these assets plus a 96,000 acre land package over core
- f Chibougamau Complex give CBay a dominant position in
the Chibougamau mining camp
SLIDE 16 TSX:NWI
16
*Roscoe Postle Associates Report for CBay, July 9, 2012
CBay Production Potential: Corner Bay
Resource (2012 43-101 using 2% Cu cutoff*) Measured: 360,000 tonnes @3.44% Cu Indicated: 465,000 tonnes @ 3.40% Cu Inferred: 734,000 tonnes @3.33% Cu High-grade copper, potential for production within one year $25 million spent on development, including ramp, prior to 2009 500 TPD to 650 TPD possible from ramp Continuous to depth - possible future shaft
SLIDE 17 TSX:NWI
17
CBay Production Potential: Cedar Bay
Cedar Bay has largest drill tested potential in the Complex Mined to 2,100-foot level, shaft down to 3,000-foot level Total ore extracted (1958 -1990): 3,782,850 tons @1.57% Cu &
3.12 g/t Au
Mineable grades and widths drilled to 4,000-foot level
Intersections from ’94-’95 Cedar Bay Deep Drill Program
SLIDE 18 TSX:NWI
18
CBay Production Potential: Perch River
Option agreement to acquire 100% signed February 2013 Advanced-stage copper project Exploration ramp sampled 12,150 tons in 1973 Property report projected ~1 million tons grading >1% Cu* Shallow (50m – 100m depth), flat-lying deposit Mineralization similar to Icon-Sullivan mine, located 15Km SW,
which produced 2.1 million tons grading 1.96% Cu
Exploration pending, potential to provide additional near-term
feed to Copper Rand mill
Excellent access and infrastructure
*AJR Geoconsulting Property Report (non-43-101-compliant) March 2007
SLIDE 19
TSX:NWI
19
CBay Exploration
Exploration upside within and adjacent to past producing mines Untested on-strike potential of ore-bearing structures Untested exploration potential, drill-ready targets elsewhere on the land package
SLIDE 20 TSX:NWI
(9.27% Cu/ 16.15m (6.7m))
Corner Bay Copper Deposit – Upside at Depth
20
CBay Exploration Potential: Corner Bay
Ramp excavated on Main Zone,
- ther zones need to be fully
evaluated Also requires additional drilling to the north, south and at depth
SLIDE 21 TSX:NWI
21
CBay Exploration Potential: Portage Island
Henderson 1 & 2 and Portage mines, drill- indicated Cu resource at Hematite Bay, Cu/Au mineralization at Baie du Commencement, two extensive high-grade magnetite bodies 2012 drilling gold prospects at Hematite Bay/McKenzie Vein Portage Island Offers the Most Exciting Near-Term Exploration Upside
McKenzie Vein Drill Core, 2012
Select Drill Results Nuinsco 2012 Drilling Gold Grade Intercept 12.23 g/t 2.34m 8.37 g/t 2.96m 5.45 g/t 3.48m 4.52 g/t 5.42m 2.31 g/t 8.62m 2.31 g/t 2.96m
SLIDE 22
TSX:NWI
22
Excellent potential in area near Copper Rand (Lac Doré South) 2002 MegaTEM survey still to be fully interpreted Good correlation between conductivity responses and known mineralization Also representative of the significant lack of exploration in the mining camp for several decades
CBay Exploration Potential: Lac Doré Complex
Enormous volume of valuable information deserves full review and cataloguing Evaluation of historic data will enhance understanding of existing occurrences and identify new opportunities
SLIDE 23
TSX:NWI
23
CBay Minerals: 2012-2013 Achievements
CEO and General Manager, Chibougamau hired New 43-101 report on resources at Corner Bay Completed closure plan for Copper Rand LBP Mining Services, Val D’Or completing internal reports on
refurbishment of Copper Rand mill, capex, operating cost and mine plan for Corner Bay
Implemented exploration drilling program via Nuinsco on
Portage Island
Initiated detailed analysis of property position and prioritized
additional exploration targets
Reviewed past producers for production scenarios Sold royalty on Eastmain gold property to make CBay debt free Optioned Perch River copper project Advanced discussions to add other near-term production assets
in Chibougamau camp
SLIDE 24
TSX:NWI
24
2014 Corner Bay in production, producing at a rate of 6,000 tonnes Cu Feasibility on second mine to put back into production (possibly Cedar Bay) Finance second mine to production
CBay Minerals: Steps To Value Realization
2013
Raise $15 million to refurbish mill and start up Corner Bay Consult with Cree Nation regarding start-up of Corner Bay Put Corner Bay into production (500 TPD-650 TPD) during
the year, subject to financing
Acquire/joint venture additional mining properties in
Chibougamau area for additional feed to mill
Continue exploration on property package, near old mines Identify next mine for production Consider creating standalone public company, subject to
market conditions
SLIDE 25
TSX:NWI
25
CBay Minerals: Steps To Value Realization
2015
Second mine into full production (likely Cedar Bay) Feasibility study on 3rd producing mine Raise funds if necessary for 3rd producing mine Production level 1,500 TPD from CBay mines on continuous
basis 2016
Three mines in full production Production level 2500-3000 TPD from CBay mines
SLIDE 26 TSX:NWI
26 26
Management
Paul L. Jones CEO & Director
Exploration professional with 30+ years experience with more than 20 junior companies, Nuinsco’s QP
Alison Sutcliffe VP Finance & CFO
CA with 25+ years experience, incl. Deloitte, Dundee Corp.
Sean Stokes Executive Vice President
25+ years communications/business development/finance experience, incl. Tiberon Minerals, Scandinavian Minerals
- Dr. David Mchaina VP Environment & Sustainable Development
20+ years experience, incl. Boliden, Westmin, Goldcorp
Roland Horst CEO CBay Minerals
35 years mining experience as a CEO, banker, geologist, incl. Orvana, Royal Nickel, International Nickel Ventures
Jean Tanguay General Manager CBay Minerals
Geologist with 19+ years experience in Chibougamau mining camp
SLIDE 27 TSX:NWI
27 27
René R. Galipeau Chairman & Director
35+ years international mining experience incl. Hudson Bay Mining, Breakwater Resources, Lac Minerals, Rio Algom
Robert Wardell C.A., BSc,
38 years experience, national partner Deloitte, Director of Katanga Mining, Elgin Mining, Allied Nevada
- Dr. Jim Franklin Geologist,
40 years experience, since 1998 Adjunct Professor at Queen’s University since 2001, Laurentian University and since 2005 at the University of Ottawa. Past president of both the Geological Association of Canada and of the Society of Economic Geologists.
Marvin Singer Lawyer,
Partner with Norton Rose LLP, significant domestic and international experience on all aspects of resource projects
Ed Guimaraes Chartered Accountant,
Executive VP and CFO of Aur Resources Inc. until the completion of the acquisition of Aur by Teck for $4.1 billion. Previously with PricewaterhouseCoopers LLP.
Qualified Independent Board
SLIDE 28
TSX:NWI
28
René Galipeau - Non Executive Chairman Roland Horst - CEO Paul Jones - CEO, Nuinsco Sean Stokes - Corporate Secretary Jeff Beck Managing Director (USA) Ocean Partners, mining
engineer formerly with Asarco, Pechiney World Trade (PWT), created Ocean Partners via management buyout from Alcan/Pechiney Group
Walter Cimowski Director (Canada) Ocean Partners, geologist
formerly with Noranda and PWT as head of copper concentrate and blister trading
Siva Pillay CFO of Ocean Partners, finance experience with Mees
Pierson, Bank of New York Commodities
CBay Board
SLIDE 29
TSX:NWI
29 29
Recently shored-up treasury with royalty sales, Ocean Partners
a financially strong partner in CBay. Cash equals opportunity in a difficult market environment
Continuous history of discoveries over a 40-year period Experienced Board of Directors and Management team Track record of value creation Experienced at creating spinoff companies – asset base offers
this potential for value creation with CBay
Solid base of exploration projects Near-term cash flow potential from CBay assets
All the Tools for Exploration Success and Wealth Creation
Summary