1. (Multivariate) Network Object-oriented systems and data - - PDF document

1 multivariate network
SMART_READER_LITE
LIVE PREVIEW

1. (Multivariate) Network Object-oriented systems and data - - PDF document

1. Network Vis. 1.1 Motivation Examples for networks and graph related data Molecular and genetic maps, biochemical pathways 1. (Multivariate) Network Object-oriented systems and data structures, scene graphs Visualization (VRML)


slide-1
SLIDE 1

1

ISOVIS

Erasmus Teaching Exchange 13 DV – Prof. Dr. Andreas Kerren

Linnaeus University

  • 1. (Multivariate) Network

Visualization

Information Visualization (186.141) TU Vienna, Austria June 13 & 14, 2013

2

ISOVIS

Erasmus Teaching Exchange 13 DV – Prof. Dr. Andreas Kerren

Linnaeus University

1.1 Motivation

  • 1. Network Vis.
  • Examples for networks and graph related data

Molecular and genetic maps, biochemical pathways Object-oriented systems and data structures, scene graphs

(VRML)

Real-time systems (state diagrams) Semantic networks and knowledge representation diagrams Project management (PERT diagrams) or documentation

management

VLSI …

3

ISOVIS

Erasmus Teaching Exchange 13 DV – Prof. Dr. Andreas Kerren

Linnaeus University

1.2 Definitions

  • 1. Network Vis.
  • Graphs are abstract structures, that can be used for

modeling relational information
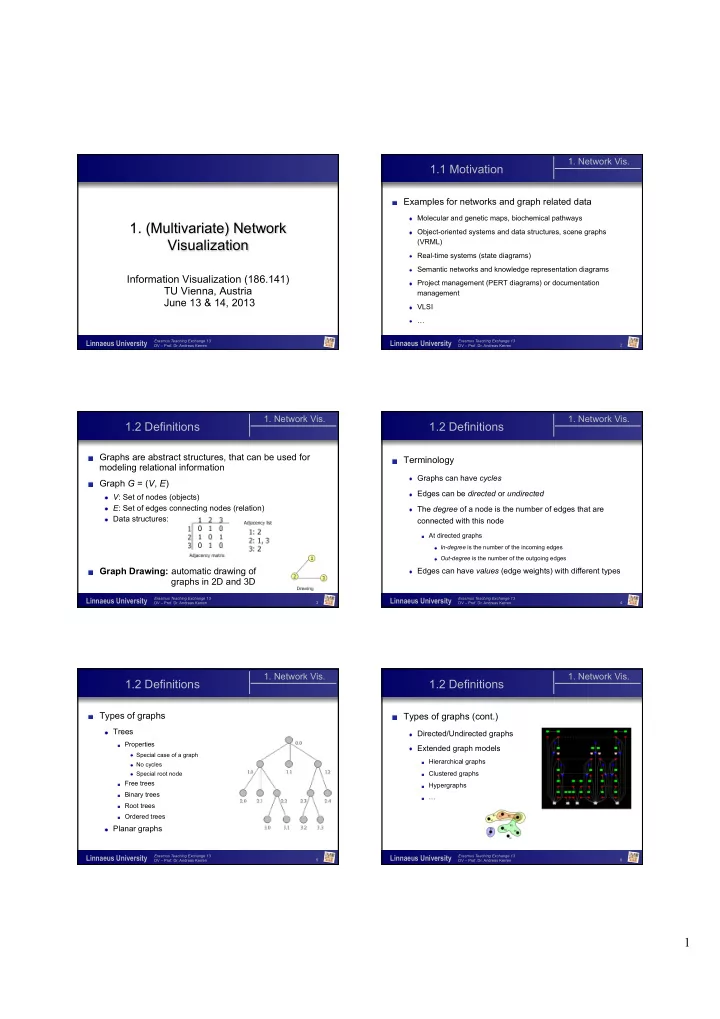
  • Graph G = (V, E)

V: Set of nodes (objects) E: Set of edges connecting nodes (relation) Data structures:

  • Graph Drawing: automatic drawing of

graphs in 2D and 3D

4

ISOVIS

Erasmus Teaching Exchange 13 DV – Prof. Dr. Andreas Kerren

Linnaeus University

1.2 Definitions

  • 1. Network Vis.
  • Terminology

Graphs can have cycles Edges can be directed or undirected The degree of a node is the number of edges that are

connected with this node

At directed graphs

In-degree is the number of the incoming edges Out-degree is the number of the outgoing edges

Edges can have values (edge weights) with different types

5

ISOVIS

Erasmus Teaching Exchange 13 DV – Prof. Dr. Andreas Kerren

Linnaeus University

1.2 Definitions

  • 1. Network Vis.
  • Types of graphs

Trees

Properties

Special case of a graph No cycles Special root node

Free trees Binary trees Root trees Ordered trees

Planar graphs

6

ISOVIS

Erasmus Teaching Exchange 13 DV – Prof. Dr. Andreas Kerren

Linnaeus University

1.2 Definitions

  • 1. Network Vis.
  • Types of graphs (cont.)

Directed/Undirected graphs Extended graph models

Hierarchical graphs Clustered graphs Hypergraphs …

slide-2
SLIDE 2

2

7

ISOVIS

Erasmus Teaching Exchange 13 DV – Prof. Dr. Andreas Kerren

Linnaeus University

1.3 Graph Drawing

  • 1. Network Vis.
  • Own research community

⇒ very large field!

I can only give an overview A good starting point for literature search and further

information are the annual Graph Drawing conferences (GD)

  • r the IEEE InfoVis conferences
  • Research areas of GD

Graph layout and positioning of nodes Scalability

8

ISOVIS

Erasmus Teaching Exchange 13 DV – Prof. Dr. Andreas Kerren

Linnaeus University

1.3 Graph Drawing

  • 1. Network Vis.
  • Research areas of GD (cont.)

Navigation in large graphs Dynamic graphs Heterogeneous node and edge types Massive node degrees Visualization of isomorphic subgraphs

  • (Embedding of additional information)
  • (Focus & Context)
  • (Comparison of graphs)

9

ISOVIS

Erasmus Teaching Exchange 13 DV – Prof. Dr. Andreas Kerren

Linnaeus University

1.3 Graph Drawing

  • 1. Network Vis.
  • Independent from layout and interaction techniques,

there are many different possibilities to draw nodes and edges

Nodes

Shape, color, size, position, label, …

Edges

Color, size, thickness, direction, label, … Shape

straight, curved, planar, orthogonal, … 10

ISOVIS

Erasmus Teaching Exchange 13 DV – Prof. Dr. Andreas Kerren

Linnaeus University

1.3 Graph Drawing

  • 1. Network Vis.
  • Drawing Conventions

Polyline Drawing Straight-line Drawing Orthogonal Drawing Grid Drawing Planar Drawing Upward Drawing Circular Drawing …

[Inspired by S. Hong und P. Eades‘ course]

11

ISOVIS

Erasmus Teaching Exchange 13 DV – Prof. Dr. Andreas Kerren

Linnaeus University

1.3.1 Aesthetics

  • 1. Network Vis.

1.3 Graph Drawing

  • A graph layout should be easy to read and to

understand, easy to remember, as well as have a certain aesthetics

[taken from S. Hong und P. Eades‘ course]

12

ISOVIS

Erasmus Teaching Exchange 13 DV – Prof. Dr. Andreas Kerren

Linnaeus University

1.3.1 Aesthetics

  • 1. Network Vis.

1.3 Graph Drawing

[taken from S. Hong und P. Eades‘ course]

  • All layout algorithms fulfill more or less a set of

aesthetics criteria

  • Furthermore, the layout itself affects the perception of

graphs

  • Problem: These aesthetics criteria are sometimes

contradictory are their computation mostly NP hard!

  • Thus, the most GD algorithms are heuristics
slide-3
SLIDE 3

3

13

ISOVIS

Erasmus Teaching Exchange 13 DV – Prof. Dr. Andreas Kerren

Linnaeus University

1.3.1 Aesthetics

  • 1. Network Vis.

1.3 Graph Drawing

Aesthetics Criteria

Edge crossings ↓ Area ↓ Symmetry ↑ Edge length ↓

Maximal edge length, uniform edge length, total edge length

Bends of edges ↓

Maximal bends, uniform bends, total bends

Resolution ↑

14

ISOVIS

Erasmus Teaching Exchange 13 DV – Prof. Dr. Andreas Kerren

Linnaeus University

1.3.1 Aesthetics

  • 1. Network Vis.

1.3 Graph Drawing

  • Example: crossings and bends

[taken from S. Hong und P. Eades‘ course]

15

ISOVIS

Erasmus Teaching Exchange 13 DV – Prof. Dr. Andreas Kerren

Linnaeus University

1.3.1 Aesthetics

  • 1. Network Vis.

1.3 Graph Drawing

  • Example: Conflict between two criteria

[taken from S. Hong und P. Eades‘ course]

16

ISOVIS

Erasmus Teaching Exchange 13 DV – Prof. Dr. Andreas Kerren

Linnaeus University

1.3.2 Force-directed GD

  • 1. Network Vis.

1.3 Graph Drawing

  • Force-directed methods model nodes and edges as

physical objects

  • Examples

Spring forces for the edges Gravitation forces for the nodes

  • Aim is to find a stable configuration, that gets by with as

few energy as possible

  • We have here also optimization problems, that are

solved locally

17

ISOVIS

Erasmus Teaching Exchange 13 DV – Prof. Dr. Andreas Kerren

Linnaeus University

1.3.2 Force-directed GD

  • 1. Network Vis.

1.3 Graph Drawing

Spring Embedder

  • Firstly presented by P. Eades, 1984
  • Approach realizes two criteria

Symmetry Uniform edge lengths

[taken from S. Hong und P. Eades‘ course]

18

ISOVIS

Erasmus Teaching Exchange 13 DV – Prof. Dr. Andreas Kerren

Linnaeus University

1.3.2 Force-directed GD

  • 1. Network Vis.

1.3 Graph Drawing

  • Problems of the classic Spring Embedder algorithm is

the high runtime and its (possibly) breakdown with very large graphs

  • Layout example:
slide-4
SLIDE 4

4

19

ISOVIS

Erasmus Teaching Exchange 13 DV – Prof. Dr. Andreas Kerren

Linnaeus University

1.3.2 Force-directed GD

  • 1. Network Vis.

1.3 Graph Drawing

  • There are many improvements of this approach, e.g.:

Inclusion of local, minimal energies

Algorithm of Kamada and Kawai, 1989

  • [T. Kamada and S. Kawai. An Algorithm for Drawing General and Undirected Graphs.

Information Processing Letters, 31(1), pp. 24-38, 1989]

Iterative, force-directed node positioning

Fruchterman and Rheingold, 1991

  • [T. Fruchterman and E. Rheingold. Graph Drawing by Force-directed Placement.

Software – Practice and Experience, 21, pp. 1129-1164, 1991]

Simulated Annealing

Davidson and Harel, 1996

  • [R. Davidson and D. Harel. Drawing Graphs Nicely Using Simulated Annealing. ACM

Transactions on Graphics, 15(4), 301-331, 1996]

20

ISOVIS

Erasmus Teaching Exchange 13 DV – Prof. Dr. Andreas Kerren

Linnaeus University

1.3.3 Layered GD

  • 1. Network Vis.

1.3 Graph Drawing

  • In another approach, called Layered GD, the layout

method firstly looks for a suitable layering that assigns each node an integer number

  • Most methods compute on an extracted, acyclic

subgraph that contains all nodes

  • A layer number is assigned to all nodes. Thus, the nodes are arranged

top-down in rows, i.e., all nodes of an acyclic graph direct down

  • The placement (order) within the rows is used for the minimization of the

number of edge crossings; mostly only until the next layer is reached

  • Even this problem is NP hard, i.e., one tries to find heuristics

21

ISOVIS

Erasmus Teaching Exchange 13 DV – Prof. Dr. Andreas Kerren

Linnaeus University

1.3.3 Layered GD

Parallel layers Radial layers

  • 1. Network Vis.

1.3 Graph Drawing

[taken from S. Hong und P. Eades‘ course]

22

ISOVIS

Erasmus Teaching Exchange 13 DV – Prof. Dr. Andreas Kerren

Linnaeus University

1.3.3 Layered GD

  • 1. Network Vis.

1.3 Graph Drawing

  • Classic algorithm of Sugiyama, 1981
  • [K. Sugiyama, S. Tagawa, and M. Toda. „Methods for Visual Understanding of

Hierarchical Systems Structures“, IEEE Trans. on Systems, Man, and Cybernetics, 11(2), pp. 109-125, 1981]

  • Another heuristic defines a fixed order of the first and last layer

and demands that each node is in the barycenter of its neighbors in the graph. This yields a linear system of equations

  • [W. Tutte, „How to Draw a Graph“, In Proc. London Math. Soc., 3(13), pp. 743-768,

1963]

  • Comparison of different heuristics, e.g.
  • [M. Laguna and R. Marti, „Heuristics and Meta-Heuristics for 2-Layer Straight Line

Crossing Minimization“, Discrete Applied Mathematics, 127(3), 2003]

23

ISOVIS

Erasmus Teaching Exchange 13 DV – Prof. Dr. Andreas Kerren

Linnaeus University

1.3.4 Graph Drawing in 3D

  • 1. Network Vis.

1.3 Graph Drawing

  • Challenge because of the growing size of real world

networks: Scalability

  • Solutions

Clustering

Collapse strong connected nodes to super nodes (see 3.3.5)

3D (more space)

Classic 2D algorithms are extended to 3D Problems

Navigation, massive overlaps, mental map, … 24

ISOVIS

Erasmus Teaching Exchange 13 DV – Prof. Dr. Andreas Kerren

Linnaeus University

1.3.4 Graph Drawing in 3D

  • 1. Network Vis.

1.3 Graph Drawing

  • Example: Linux kernel

http://perso.wanadoo.fr/pascal.brisset/kernel3d/kernel3d.html

slide-5
SLIDE 5

5

25

ISOVIS

Erasmus Teaching Exchange 13 DV – Prof. Dr. Andreas Kerren

Linnaeus University

1.3.4 Graph Drawing in 3D

  • 1. Network Vis.

1.3 Graph Drawing

  • Example: 3D orthogonal GD
  • D. Wood et al.

26

ISOVIS

Erasmus Teaching Exchange 13 DV – Prof. Dr. Andreas Kerren

Linnaeus University

1.3.5 Applications

  • 1. Network Vis.

1.3 Graph Drawing

  • There are hundreds of

applications (also in InfoVis) that use or extend classic GD techniques

  • Tools
  • JUNG, Walrus, …

by B. Huffaker

http://www.caida.org/tools/visualization/walrus/ 27

ISOVIS

Erasmus Teaching Exchange 13 DV – Prof. Dr. Andreas Kerren

Linnaeus University

1.3.5 Applications

  • 1. Network Vis.

1.3 Graph Drawing

  • Visualization of Biochemical Pathways

by F. Schreiber

28

ISOVIS

Erasmus Teaching Exchange 13 DV – Prof. Dr. Andreas Kerren

Linnaeus University

1.3.5 Applications

  • 1. Network Vis.

1.3 Graph Drawing

  • Map layouts like MetroMaps

http://dx.doi.org/10.1109/TVCG.2010.81 29

ISOVIS

Erasmus Teaching Exchange 13 DV – Prof. Dr. Andreas Kerren

Linnaeus University

1.4 Dynamic GD

  • 1. Network Vis.
  • During the past years, networks became more

important that change with time, e.g.

Biochemical networks have to be modified because of new

discovered paths

Social networks change through new contacts between

people

  • Visualizations must preserve the „Mental Map“

„Old structures“ should be recognized again

  • [K. Misue, P. Eades, W. Lai, and K. Sugiyama, "Layout Adjustment and the

Mental Map", Journal of Visual Languages and Computing 6 (1995), 183-210.]

30

ISOVIS

Erasmus Teaching Exchange 13 DV – Prof. Dr. Andreas Kerren

Linnaeus University

1.4.1 Morphing

  • 1. Network Vis.

1.4 Dynamic GD

  • There are several approaches to address this problem
  • One of them is the so-called Morphing
  • Idea
  • Visualize the transitions between two layouts using smooth animations
  • Advantages
  • Looks very good (good aesthetics)
  • Disadvantages
  • Nodes usually change their position
  • Eventually, new added nodes or deleted nodes are not correctly identified
slide-6
SLIDE 6

6

31

ISOVIS

Erasmus Teaching Exchange 13 DV – Prof. Dr. Andreas Kerren

Linnaeus University

1.4.1 Morphing

  • 1. Network Vis.

1.4 Dynamic GD

  • Morphing can be applied to each 2D/3D layout

algorithm:

If a node is changing its position in the new layout then

compute an animation path between the old and the new position with the help of interpolation

  • Example system: GraphAEL
  • [C. Erten, P. J. Harding, S. G. Kobourov, K. Wampler, and G. Yee, "GraphAEL:

Graph Animations with Evolving Layouts", 11th Symposium on Graph Drawing (GD), p. 98-110, 2003.] Here, mainly force-based methods are used

http://graphael.cs.arizona.edu/graphael/

32

ISOVIS

Erasmus Teaching Exchange 13 DV – Prof. Dr. Andreas Kerren

Linnaeus University

1.4.1 Morphing

  • 1. Network Vis.

1.4 Dynamic GD

http://graphael.cs.arizona.edu/graphael/

33

ISOVIS

Erasmus Teaching Exchange 13 DV – Prof. Dr. Andreas Kerren

Linnaeus University

1.4.2 Foresighted GD

  • 1. Network Vis.

1.4 Dynamic GD

  • If we know a sequence of graph in advance or if it is

possible to precalculate it, then there is another method:

  • Foresighted Graphlayout
  • [S. Diehl, C. Görg, and A. Kerren. „Preserving the Mental Map using Foresighted

Layout“. In Proceedings of Joint Eurographics - IEEE TCVG Symposium on Visualization, VisSym `01, Springer Verlag, 2001.]

  • Idea

Compute a supergraph based on the sequence of graphs Position the nodes at the beginning in such a way that they

don‘t change their positions later

34

ISOVIS

Erasmus Teaching Exchange 13 DV – Prof. Dr. Andreas Kerren

Linnaeus University

1.4.2 Foresighted GD

  • 1. Network Vis.

1.4 Dynamic GD

  • Advantages

Preserving the mental map Independent of the used graph layout algorithm

  • Disadvantages

Sequence of graphs is often unknown Partly bad aesthetical results (gaps at the beginning, etc.)

35

ISOVIS

Erasmus Teaching Exchange 13 DV – Prof. Dr. Andreas Kerren

Linnaeus University

1.5 InfoVis ↔ GD

  • 1. Network Vis.
  • Aim of Information Visualization

InfoVis is a research area that focuses on the use of

visualization techniques to help people understand and analyze abstract data

  • Comparing to Graph Drawing, the focus is not on the

pure layout of a graph

  • More important are

Interacting with the graph visualization Exploring the possibly huge graph topology Adding of additional information (attributes) into the drawing …

36

ISOVIS

Erasmus Teaching Exchange 13 DV – Prof. Dr. Andreas Kerren

Linnaeus University

1.5.1 The Influence of InfoVis

  • 1. Network Vis.

1.5 InfoVis ↔ GD

  • What is a network comparing to a graph?

Network = graph + attributed information to nodes and edges

(also called multivariate network)

  • Just to give you some impressions, we will look to some

specific aspects

Special graph drawing techniques that support InfoVis tasks Interactive exploration and clustering Multivariate network visualization

Semantic substrates, attribute-driven layouts, …

slide-7
SLIDE 7

7

37

ISOVIS

Erasmus Teaching Exchange 13 DV – Prof. Dr. Andreas Kerren

Linnaeus University

1.5.2 Techniques for Special InfoVis Tasks

  • Hierarchical Edge Bundles [Holten, InfoVis06]

Avoid Clutter in Networks

Graph Visualization

  • 1. Network Vis.

1.5 InfoVis ↔ GD

38

ISOVIS

Erasmus Teaching Exchange 13 DV – Prof. Dr. Andreas Kerren

Linnaeus University

1.5.2 Techniques for Special InfoVis Tasks

  • New solution with possibility to change the blending

strength

[Demo]

http://flare.prefuse.org/apps/dependency_graph

  • 1. Network Vis.

1.5 InfoVis ↔ GD

39

ISOVIS

Erasmus Teaching Exchange 13 DV – Prof. Dr. Andreas Kerren

Linnaeus University

1.5.2 Techniques for Special InfoVis Tasks

  • 1. Network Vis.

1.5 InfoVis ↔ GD

  • Edge Clustering
  • [Weiwei Cui et al. „Geometry-Based Edge Clustering for Graph Visualization“. In

Proceedings of Information Visualization 2008.]

  • Idea

Avoid clutter of edges Compute edge bundles Uses a control mesh for

controlling purposes

[Video]

40

ISOVIS

Erasmus Teaching Exchange 13 DV – Prof. Dr. Andreas Kerren

Linnaeus University

1.5.2 Techniques for Special InfoVis Tasks

  • NodeTrix [Henry et al., InfoVis07]

Combined techniques for

a better structuring

  • 1. Network Vis.

1.5 InfoVis ↔ GD

[Video]

41

ISOVIS

Erasmus Teaching Exchange 13 DV – Prof. Dr. Andreas Kerren

Linnaeus University

1.5.3 Interactive Exploration and Clustering

  • 1. Network Vis.

1.5 InfoVis ↔ GD

  • Visualizing online social networks
  • J. Heer and D. Boyd, InfoVis `05

[Video] http://jheer.org/vizster/

42

ISOVIS

Erasmus Teaching Exchange 13 DV – Prof. Dr. Andreas Kerren

Linnaeus University

1.5.3 Interactive Exploration and Clustering

  • 1. Network Vis.

1.5 InfoVis ↔ GD

  • Overview+Detail with Constraint-based Cooperative

Layout

  • [Tim Dwyer et al. „Exploration of Networks Using Overview+Detail with

Constraint-based Cooperative Layout “. In Proceedings of Information Visualization 2008.]

  • Idea

Detailed view is NOT just a

zoomed in view of the overview

Local optimizations but preserving

mental map of the whole graph

Focus view uses a constrained-

based graph layout

[Video]

slide-8
SLIDE 8

8

43

ISOVIS

Erasmus Teaching Exchange 13 DV – Prof. Dr. Andreas Kerren

Linnaeus University

  • Multivariate Data Integration

Often, we have multivariate data attached to network

elements ⇒ a node/edge has many attributes

Primary data: directly measured, … Secondary data: derived, computed, …

Current state-of-the-art solutions

1.5.4 Multivariate Networks

  • 1. Network Vis.

1.5 InfoVis ↔ GD

44

ISOVIS

Erasmus Teaching Exchange 13 DV – Prof. Dr. Andreas Kerren

Linnaeus University Bar Charts

  • Integrated Approaches

(mostly replacing nodes by diagrams)

[L. Broisjuk et al., Silico Biology, 2004]

1.5.4 Multivariate Networks

  • 1. Network Vis.

1.5 InfoVis ↔ GD

45

ISOVIS

Erasmus Teaching Exchange 13 DV – Prof. Dr. Andreas Kerren

Linnaeus University

  • Multiple Coordinated Views

[R. Shannon et al., UCD TechRep08]

1.5.4 Multivariate Networks

  • 1. Network Vis.

1.5 InfoVis ↔ GD

46

ISOVIS

Erasmus Teaching Exchange 13 DV – Prof. Dr. Andreas Kerren

Linnaeus University

1.5.4 Multivariate Networks

  • 1. Network Vis.

1.5 InfoVis ↔ GD

  • Semantic Substrates
  • [B. Shneiderman and A. Aris. Network Visualization by Semantic Substrates. IEEE

Transactions on Visualization and Computer Graphics, 12(5), pp. 733-740, 2006]

  • Idea

Layout is based on user-defined semantic substrates

Non-overlapping regions for nodes Node positioning is dependent on the attributes

Slider in order to control the visibility of the edges. Thus, it is

possible to simplify the edge clutter

47

ISOVIS

Erasmus Teaching Exchange 13 DV – Prof. Dr. Andreas Kerren

Linnaeus University

1.5.4 Multivariate Networks

  • 1. Network Vis.
  • Each region

corresponds to a level

  • f jurisdiction in the

legal system of the US

  • Nodes corresponds to

the different cases (1978-2005); Node size corresponds to the number of references

  • n that case
  • Edges corresponds to

the single references

1.5 InfoVis ↔ GD

[Video]

48

ISOVIS

Erasmus Teaching Exchange 13 DV – Prof. Dr. Andreas Kerren

Linnaeus University

1.5.4 Multivariate Networks

  • 1. Network Vis.

1.5 InfoVis ↔ GD

  • Attribute-Driven Topology (ADT) and Hybrid Approaches
  • [I. Jusufi, A. Kerren, and B. Zimmer. Multivariate Network Exploration with JauntyNets.

17th International Conference on Information Visualisation (IV ’13), London, UK, 2013. IEEE, (to appear)]

  • Idea of JauntyNets

Hybrid approach, but the core contribution is an extension of

force-based layout algorithms è ADT

Use of interaction and data mining techniques together

  • The benefit of the approach is that the user can decide if

the graph topology or the multivariate attributes should get more attention

slide-9
SLIDE 9

9

49

ISOVIS

Erasmus Teaching Exchange 13 DV – Prof. Dr. Andreas Kerren

Linnaeus University

1.5.4 Multivariate Networks

  • 1. Network Vis.

1.5 InfoVis ↔ GD

  • JauntyNets

50

ISOVIS

Erasmus Teaching Exchange 13 DV – Prof. Dr. Andreas Kerren

Linnaeus University

1.5.4 Multivariate Networks

  • 1. Network Vis.

1.5 InfoVis ↔ GD

  • JauntyNets